
IETLS Task 1. Please review my essay
The line graph compares figures for the proportion of residents in Australia whose home countries were in Asia, the UK or other regions between 1976 and 2011.
It is clear that there was a slight increase in the proportion of people who resided in Australia yet were not born there over the period. Moreover, while the percentage of UK demographics saw a drop, there was a significant increase in that of Asian group residing in Australia.
In 1976, the UK headed the list of the proportion of immigrants to Australia, accounting for about 14%, while this number in Asia and other regions was 3% and 11% respectively. Over the 35-year period, the proportion of UK demographics in Australia went hit the bottom of 5% in 2011. In contrast, more people born in Asia chose to settle down in Australia as the figures reach the peak of 15%.
The figures for others seemed inconsistent, with a drop of 7% in 1986 before going up dramatically to nearly 15% in 2006, then a marginal drop to 13% by 2011. The total of Australian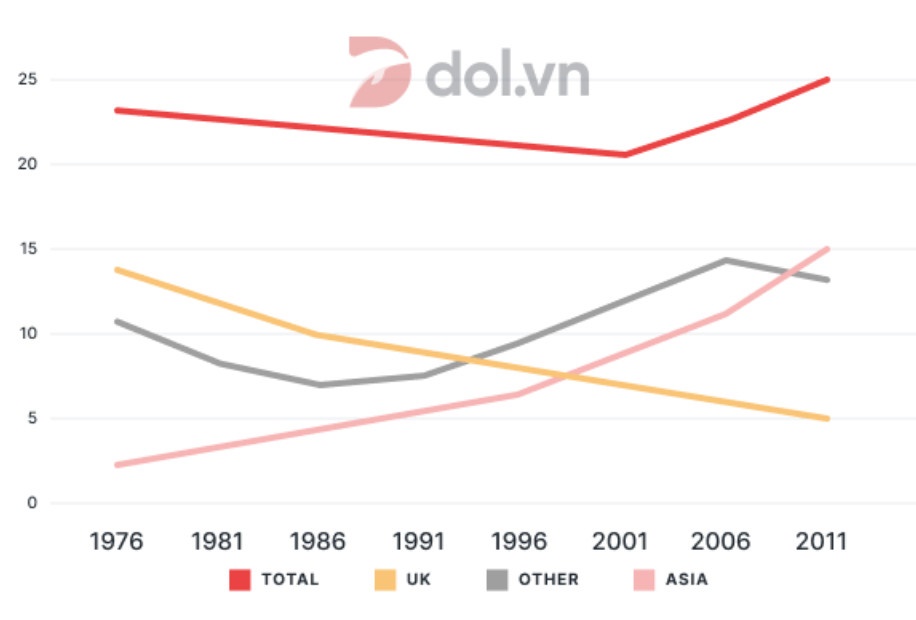
immigrants witnessed a marginal decrease to about 20% in 2001, then started a continuous increase by 5% for the rest of the period.
Top answer
The line graph compares figures for t he proportion s of residents in Australia whose home countries of birth were in Asia, the UK or other regions between 1976 and 2011. It is clear that T here was a slight increase in the proportion of people who resided in Australia , yet were not born there over the period. Moreover, while the percentage of UK - born immigrants demographics saw a drop, there was a significant increase in that of for the Asian grou p.
- The line graph compares figures for t he proportion s of residents in Australia whose home countries of birth were in Asia, the UK or other regions between 1976 and 2011.
- It is clear that T here was a slight increase in the proportion of people who resided in Australia , yet were not born there over the period.
- Moreover, while the percentage of UK - born immigrants demographics saw a drop, there was a significant increase in that of for the Asian grou p.
- residing in Australia.
- In 1976, the UK headed the list of the proportion of immigrants to Australia, accounting for about 14%, while this number in the figures for Asia and other regions was were 3% and 11% respectively.
Get the Weekly English Kit 📬
New words, one handy idiom, and a 2-minute quiz — delivered to your inbox to keep your streak alive.
The line graph compares figures for the proportions of residents in Australia whose home countries of birth were in Asia, the UK or other regions between 1976 and 2011.
It is clear that T
 Related Questions