
Ielts Wrting Task 1 Multiple Charts
Task:
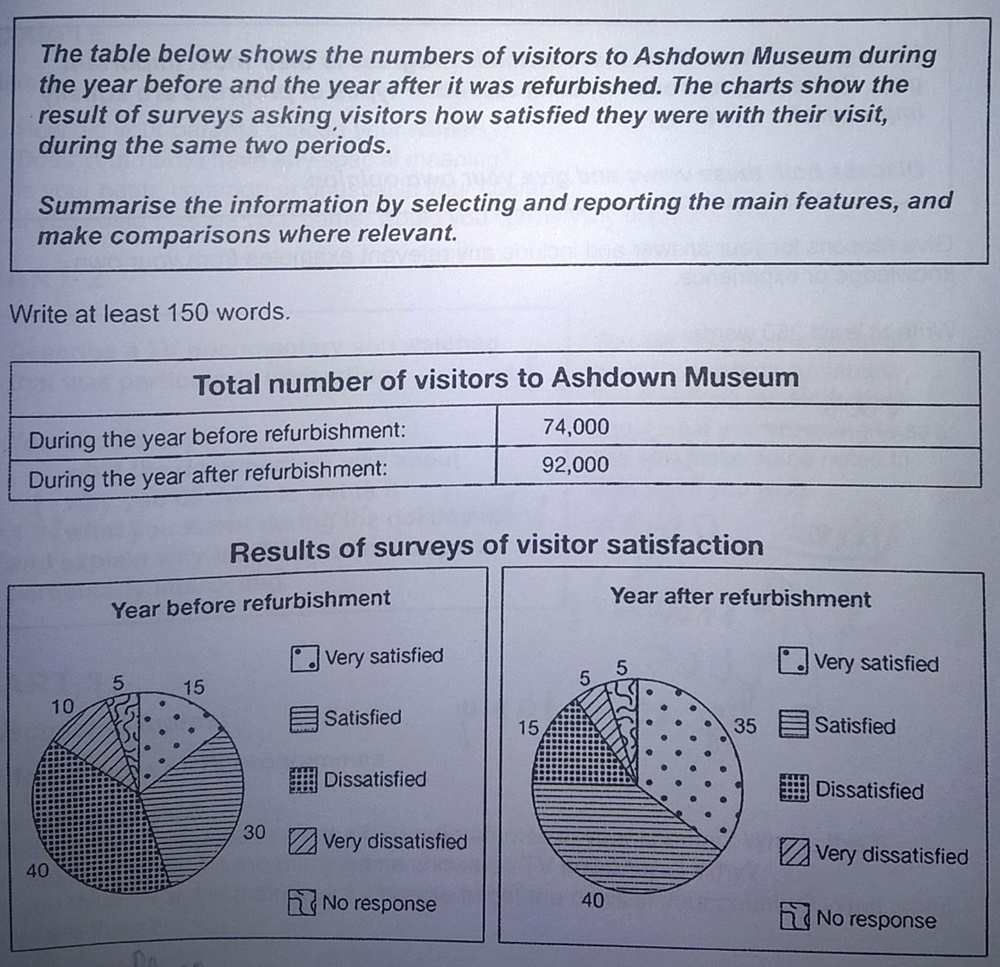
The table illustrates quantity of tourists to Ashdown Museum in the year before and after it was refurbished while the charts give information about the outcomes survey asking tourists how satisfied they were during two periods as well as the table shows.
Overall, it is evident that there is an effective improvement in numbers of visitors after refurbishment. Besides, each different type of visitor satisfaction also experienced a remarkable change.
As regards number of visitors, before the upgrade the museum received 74000 tourists to explore. However, it significantly increased to 92000 after the construction was finished.
When it comes to the result of surveys, obviously the largest of visitor satisfaction before and after refurbishment shared the same percentage for Dissatisfied and Satisfied respectively at 40%. In details, after two periods, the most positive satisfaction rose from 15% to 35%, followed by the satisfied increased slightly by 10% to 30%. By contrast, the other opposed attitudes witnessed a negative change: the proportion of dissatisfied plunged from 40% to 15%, whereas the figure of very dissatisfied halved to 5%, leaving no response remained during two periods.
Top answer
The table illustrates quantity gives the number of tourists (wrong word) to Ashdown Museum in the year before and after it was refurbished. while T he two pie charts give information about the outcomes the levels of satisfaction (very satisfied, satisfied, dissatisfied, very dissatisfied) from visitor survey s taken during the same two years. asking tourists how satisfied they were during two periods as well as the table shows.
- The table illustrates quantity gives the number of tourists (wrong word) to Ashdown Museum in the year before and after it was refurbished.
- while T he two pie charts give information about the outcomes the levels of satisfaction (very satisfied, satisfied, dissatisfied, very dissatisfied) from visitor survey s taken during the same two years.
- asking tourists how satisfied they were during two periods as well as the table shows.
- Overall, it is evident that ("Clear, obvious, evident, apparent" - these are opinion words.
- Do not write opinions in Task 1.
Get the Weekly English Kit 📬
New words, one handy idiom, and a 2-minute quiz — delivered to your inbox to keep your streak alive.
The table illustrates quantity gives the number of tourists (wrong word) to Ashdown Museum in the year before and after it was refurbished. while The two pie charts give information abo
 Related Questions