
Ielts writting task 1
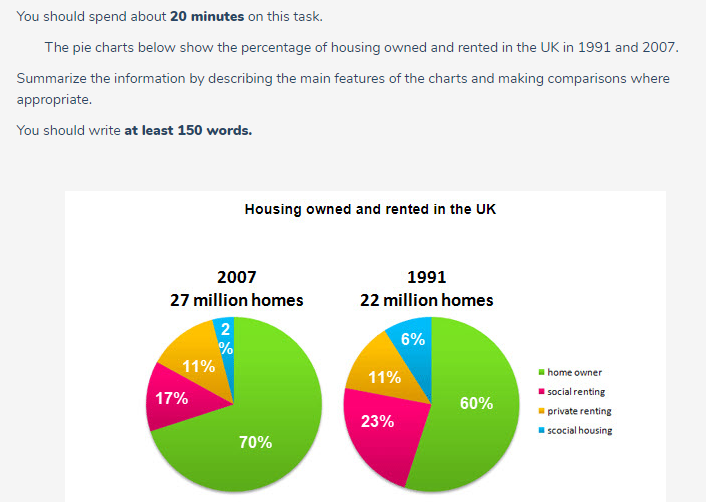
The bar charts compared two separated period 1991 and 2007 in terms of the percentage of housing owned and rented in the UK with fours factors home owner, social renting, private renting and social housing.
Overall, the total amount of proportion housing owned and rented in 2007 was clearly higher than the year of 1991. The home owner accounted for the largest percentage among four categories.
By 1991, home owner reached the highest proportion around 60%, and saw a significant increase from 60% to 70% in 2007 and became the largest segment of the bar charts. Social housing, which was the least significant part of the chart, stood at 6% in 1991 before dropping gradually to only 2% in 2007.
Social renting accounted for 23% in 1991 however became less popular in 2003 and followed social housing to hit a free fall to 17%. Private renting remained unchanged through all the period shown around 11%.
Top answer
The bar charts compared (use present tense for charts and graphs) two years, separated period (wrong word. A period is a span of time with a beginning and end. 1991 and 2007 in terms of the percentage of housing owned and rented in the UK divided into with fours (wrong form) factors categories: home owner, social renting, private renting and social housing.
- The bar charts compared (use present tense for charts and graphs) two years, separated period (wrong word.
- A period is a span of time with a beginning and end.
- 1991 and 2007 in terms of the percentage of housing owned and rented in the UK divided into with fours (wrong form) factors categories: home owner, social renting, private renting and social housing.
- Overall, the total amount of proportion housing owned and rented (that does not make sense) in 2007 was clearly higher than the year of in 1991.
- The home owner accounted for the largest percentage among the four categories.
Get the Weekly English Kit 📬
New words, one handy idiom, and a 2-minute quiz — delivered to your inbox to keep your streak alive.
The bar charts compared (use present tense for charts and graphs) two years, separated period (wrong word. A period is a span of time with a beginning and end. 1991 and 2007 in terms of the percentage of housing owned and rented in the UK
 Related Questions