
IELTS WRITING TASK1: The graph below shows changes in global food ad oil prices between 2000 and 2011.
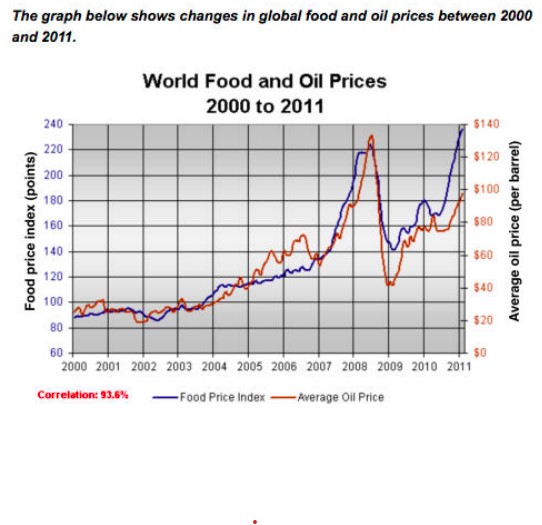
The given line graph depicts the global variation of oil and food prices during an 11-year period beginning in 2000.
Overall, it is clear that the cost of paying for oil and paper increased throughout this period. Both commodities experienced similar changes and simultaneously reached their highest peak in 2008.
In 2000, the food price index remained below 90 points, although average oil prices stayed around $30 per barrel. The figure for both commodities remained steady over the next two years, with a tiny decline toward the end of 2002 and some of the first months of 2003 before rapidly climbing during the following four years. By 2007, the food indicator went up by 50 points, and oil costs had more than doubled compared to 2000.
Both commodities increased dramatically over one year, beginning in 2007. The food index peaked at almost 220 points, and oil hit around $130 per barrel. However, following the rapid rise, these commodities fell. The price of oil plummeted to just over $40 a barrel, while the food index sank to 140 points. Finally, these indices began to rise again during the next three years. The average price of oil has risen to about $100 per barrel. The food index grew faster, climbing to nearly 240 points in 2011.
Get the Weekly English Kit 📬
New words, one handy idiom, and a 2-minute quiz — delivered to your inbox to keep your streak alive.
 Related Questions