
IELTS Writing task 1: Young adult unemployment rates
Hi guys, I know you're busy, but I really hope you could spend some time to give me some feedback. I really appreciate it. Thanks so much. Have a nice day!
Question: The graph below shows changes in young adult unemployment rates in England between 1993 and 2012.
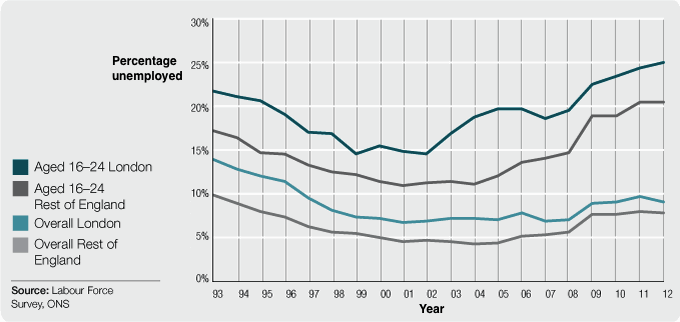
The line graph compares the percentage of unemployed young adults in England over the period of 20 years.
Overall, the proportion of jobless youth aged 16-24 in London and the rest of England increased while the figures for overall London and overall rest of England fell from 1993 to 2012.
In 1993, the unemployment rate of 16-24 year old Londoners who did not have a job was at approximately 22%, which was about 5% more of the data for the same age group in the rest of England. Over the following nine years, although both the figures for unemployed young people in London and the rest of England declined gradually, the former started to rise rapidly in 2002, reaching at exactly 25% in 10 years later while the latter experienced a gradual increase, having stayed just over 20% by 2012.
Regarding the rates of overall London and overall rest of England, they were about 14% and 10% respectively at the beginning of the surveyed period. From 1993 to 2001, there was a steady drop in both of the figures before remaining stable in the 2001-2005 period. Over the next 6 years, the unemployment rates of overall London and the rest of the country almost doubled, to just under 10% and 8% respectively.
Top answer
The line graph compares (To what? We compare two or more things, not just one thing. ) the percentage of unemployed young adults in England over the period of 20 years .
- The line graph compares (To what?
- We compare two or more things, not just one thing.
- ) the percentage of unemployed young adults in England over the period of 20 years .
- (Which 20 years?
- 1650-1670?
Get the Weekly English Kit 📬
New words, one handy idiom, and a 2-minute quiz — delivered to your inbox to keep your streak alive.
The line graph compares (To what? We compare two or more things, not just one thing. ) the percentage of unemployed young adults in England over the period of 20 years. (Which 20 years? 1650-1670? 1880-1900? 1910-1930?)
As in your earlier essay, you did not describe the fig
 Related Questions