
IELTS WRITING TASK 1: WATER USAGE
I would be grateful if someone here spends a little time to give me some advices about my essay.
IELTS Writing Task 1: 'water use' pie charts
The pie charts below compare water usage in San Diego, California and the rest of the world.
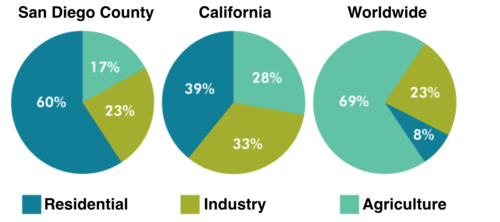
The pie charts provide information about the proportions of water used for residential, industrial and agricultural purposes in San Diego, California and the remaining areas around the world.
It is noticeable that people worldwide uses most of water for agriculture, whereas the largest proportions of water in San Diego and California are used for households.
The proportion of water for industrial usage in California is 33%, compared to 23% that of San Diego. In contrast, people of San Diego uses three-fifths of their water for residential usage, while the percentage for San Diego is only 39%. The figures for water used for farming in both San Diego and California are quite modest, roughly 17% and 28% respectively.
In other places in the world, only a mere 8% of water is used for their residents, around seven times smaller than that of San Diego. People around the world uses a massive 69% of water for agriculture, while 23% of the water is used for industrial purposes.
Top answer
Red Moon I would be grateful if someone here spends a little time to give me some advice about my essay. Advice and also feedback are non-count. ) and the remaining areas (incorrect) around the world.
- Red Moon I would be grateful if someone here spends a little time to give me some advice about my essay.
- Advice and also feedback are non-count.
- ) and the remaining areas (incorrect) around the world.
- (It is a tricky diagram.
- It entices students to give incorrect descriptions like yours.
Get the Weekly English Kit 📬
New words, one handy idiom, and a 2-minute quiz — delivered to your inbox to keep your streak alive.
Red MoonI would be grateful if someone here spends a little time to give me some advice about my essay.
Advice and also feedback are non-count.
The pie charts provide information about the proportions of water used for residential, industrial and agricultural purposes in San Diego, California
 Related Questions