
IELTS Writing Task 1 to correct EXPORT
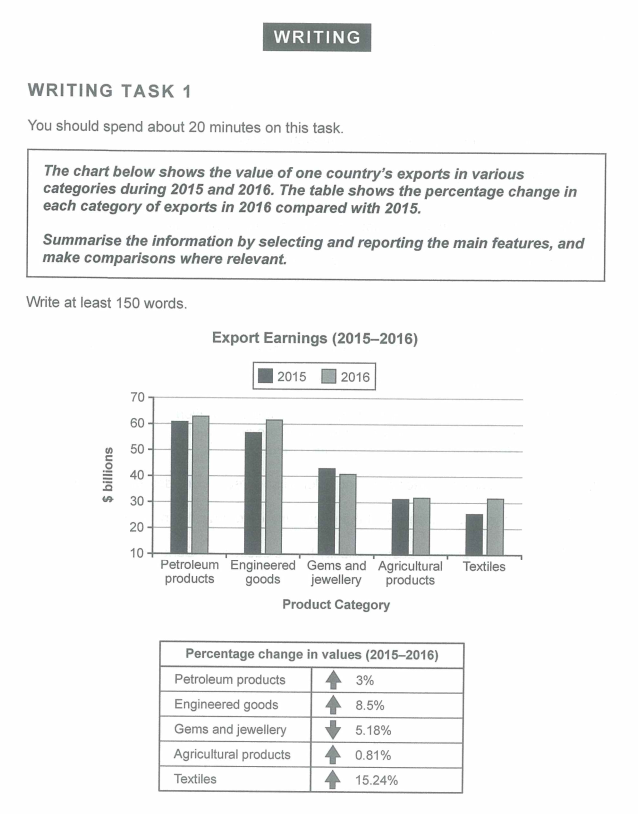
The bar chart illustrates the export proceeds of a certain country in petroleum, engineered and agricultural products as well as in jewellery and textiles in 2015 and 2016 in billions of dollars. The percentage change in each category during the given period is presented in the table.
Overall, an export increment was observed in each category except for gems and jewellery. The most significant increase was in textiles and engineered goods whereas the other areas showed marginal increases.
The highest earnings were seen in petroleum products as well as in skills-intensive engineered goods at around $60 billion. However, the latter showed almost triple increase in terms of percentage (3% compared to 8.5%).
When it comes to the remaining categories, the objects that are worn for personal adornment decreased by 5.18% to just under $41 billion. On the other hand, textile goods demonstrated a very promising dynamic going up to 15.24% reaching over $60 billion. The labour intensive farm produce did not show much movement with an increase of just 0.81% making it almost equal with clothes category.
Get the Weekly English Kit 📬
New words, one handy idiom, and a 2-minute quiz — delivered to your inbox to keep your streak alive.
 Related Questions