
Ielts writing task 1: the proportion of women members of parliament in European nations from 2000 to 2012.
The line graph compares the proportion of women members of parliament in European nations from 2000 to 2012.
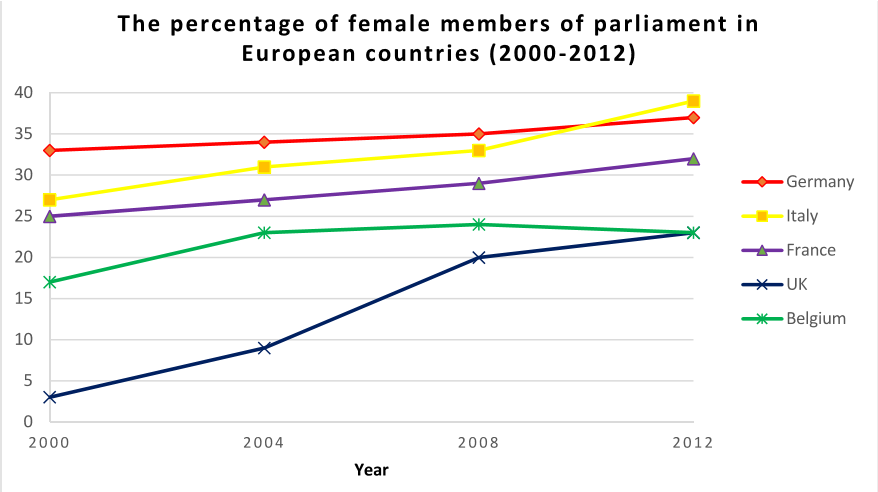
Overall, the percentage of female members of parliament increased in all five countries during the research period. Additionally, the UK experienced the most dramatic change over the -12-year period.
In 2000, the number of female MPs in Germany began at almost 35% and then went up gradually to exactly 35% in 2008. The figure for Italy, France and Belgium were lower at about 26%, 25%, and above 15% respectively in 2000, whereas the UK accounted for the lowest number with only about 4% at the same time. Despite some fluctuations, the proportion of women Mps in Germany continued to rise steadily, ending at over 35% in 2012.
There was a sharp increase in the figure for Italy, at almost 40% in 2012, overtaking the figure for Germany, and became the highest point of the whole line graph, compared with over 30% in France, and 23& in Belgium. Meanwhile, in Britain saw a dramatic rise to 23% which were similar to that of Belgium at the end of the period.
Get the Weekly English Kit 📬
New words, one handy idiom, and a 2-minute quiz — delivered to your inbox to keep your streak alive.
 Related Questions