
[IELTS writing task 1 - table] Please review my essay
Hello,
Please review my IELTS essay task 1.
Thank you in advance,
The question:
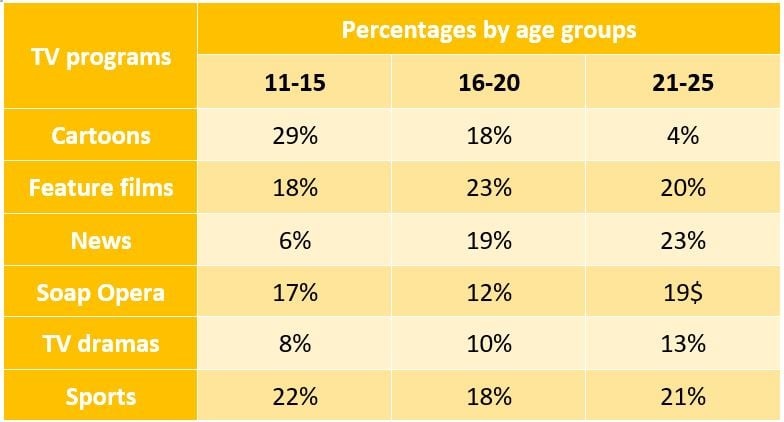
The table below shows a survey on the preference of different age groups in a European country on different TV programs in 2012. Summarize the information by selecting and reporting the main features and make comparisons where relevant.
And the following is my essay:
The table gives information from a survey of the preference on six TV programs (cartoons, features films, news, soap opera, TV dramas, sports) of three age groups in a country in Europe in 2012.
Overall, the highest percentage of people aged from 11 to 15 years old was for cartoons, while those of 16-to-20-year-old and 21-to-25-year-old people were for feature films and news respectively.
With the 11-15 age group, people who like cartoons accounted for 29% which much higher those of sports, feature films and soap opera programs with 22%, 18% and 17% respectively. News and TV dramas had much less percentage of preference, with only 8% and 6% respectively.
In terms of the 16-20 age group, the percentage for six programs were slightly different ranging from 23% for feature films to 10% for TV dramas. While only 4% of people aged from 20 to 26 like cartoons which much lower than other programs ranging from to 13% to 23%.
Top answer
The table gives information from a 2012 survey of the preference of six types of TV programs (cartoons, features films, news, soap opera, TV dramas, and sports) of people aged 11 to 25, divided into three age groups in a country in Europe an nation in 2012 . Overall, the highest percentage of people aged from 11 to 15 years old selected was for cartoons, while those the favorite shows for 16-to-20-year-old and 21-to-25-year-old people were for feature films and news respectively. With In the 11-15 age group, people who liked cartoons best accounted for 29% ; this was which much higher those of followed by sports, feature films and soap opera programs with 22%, 18% and 17% respectively.
- The table gives information from a 2012 survey of the preference of six types of TV programs (cartoons, features films, news, soap opera, TV dramas, and sports) of people aged 11 to 25, divided into three age groups in a country in Europe an nation in 2012 .
- Overall, the highest percentage of people aged from 11 to 15 years old selected was for cartoons, while those the favorite shows for 16-to-20-year-old and 21-to-25-year-old people were for feature films and news respectively.
- With In the 11-15 age group, people who liked cartoons best accounted for 29% ; this was which much higher those of followed by sports, feature films and soap opera programs with 22%, 18% and 17% respectively.
- News and TV dramas were the least preferred, had much less percentage of preference , with only 8% and 6% respectively.
- In terms of the 16-20 age group, the percentages had the narrowest range of the groups, for six programs were slightly different ranging from a high of 23% for feature films to a low of 10% for TV dramas.
Get the Weekly English Kit 📬
New words, one handy idiom, and a 2-minute quiz — delivered to your inbox to keep your streak alive.
The table gives information from a 2012 survey of the preference of six types of TV programs (cartoons, features films, news, soap opera, TV dramas, and sports) of
 Related Questions