
Ielts Writing Task 1 (T1.C5). Please Help Me Check.
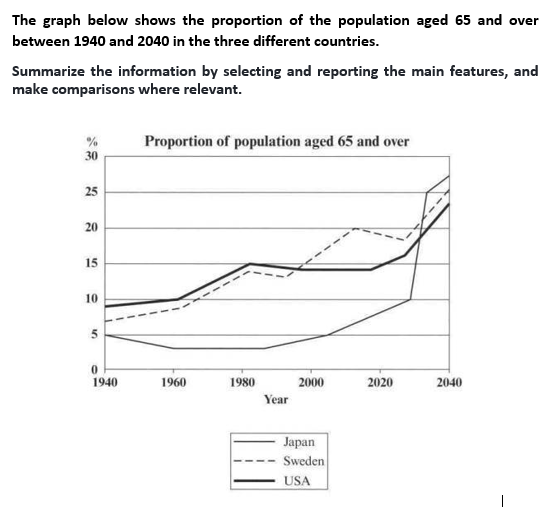
The graph illustrates the rate of the ageing population, those are 65 years old and over in Japan, USA and Sweden in the period from 1940 to 2040.
At the beginning in 1940, the proportion of people having a long lifespan in USA was at the highest position, nearly 10%, while in Sweden and Japan was about 7% and 5% respectively. From 1940 to 1980, Japan experienced a gradual fall in the percentage of the old aged 65 and over, approximately 3%, in contrast, the trend in USA and Sweden had a tendency to increase steadily.
In the period from 1980 to 2018, there was an downward trend in the proportion of people between the age 65 and over in USA, from 15% down to 14% while in Sweden, the proportion increased considerably and it climbed rapidly in Japan, about 7% in 38 years. In the next 22 years, the percentage of population aged in the range from 65 to above in all three nations is expected to improve sharply, especially in Japan, a remarkable recovery is forecasted, which probably leads to the highest place in 2040.
Top answer
The graph illustrates the rate change in the percentage of the ageing population, those are 65 years old and ove r, in Japan, the USA and Sweden in the period from 1940 to 2040. At the beginning in 1940, the proportion of people having a long lifespan in the USA was at the highest position, nearly 10%, while in Sweden and Japan it was about 7% and 5% respectively. From 1940 to 1980, Japan experienced a gradual fall in the percentage of the old people aged 65 and ove r to approximately 3 %.
- The graph illustrates the rate change in the percentage of the ageing population, those are 65 years old and ove r, in Japan, the USA and Sweden in the period from 1940 to 2040.
- At the beginning in 1940, the proportion of people having a long lifespan in the USA was at the highest position, nearly 10%, while in Sweden and Japan it was about 7% and 5% respectively.
- From 1940 to 1980, Japan experienced a gradual fall in the percentage of the old people aged 65 and ove r to approximately 3 %.
- I n contrast, the trend in graph for the USA and Sweden had a tendency to increase rose steadily.
- In the period from 1980 to 2018, there was an a slight fall downward trend in the proportion of people between the age d 65 and over in the USA, from 15% down to 14 %.
Get the Weekly English Kit 📬
New words, one handy idiom, and a 2-minute quiz — delivered to your inbox to keep your streak alive.
The graph illustrates the rate change in the percentage of the ageing population, those are 65 years old and over, in Japan, the USA and Sweden in the period from 1940 to 2040.
At the beginning in 1940, the proportion of people hav
 Related Questions