
IELTS Writing Task 1 - Report - Pie Chart
I need help in correcting my writing, thank you so much!
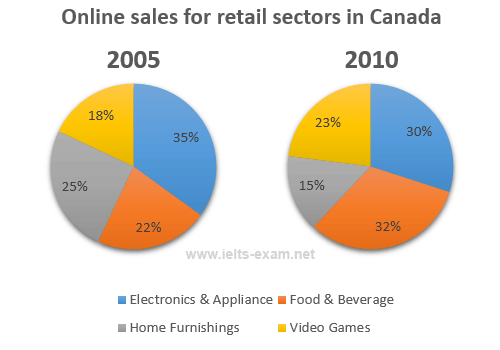
The two pie charts below show the online shopping sales for retail sectors in Canada in 2005 and 2010.
Summarise the information by selecting and reporting the main features, and make comparisons where relevant.
The two pie charts compare the sales of shopping online for retail sectors in Canada in 2005 and 2009. Each chart is divided into 4 parts: Electronics and Appliance, Food and Beverage, Home furnishings and Video Games.
In 2005, Electronics and Appliance section had the largest percentage of online sales, at 35% of the total. In second place on the chart was Home Furnishing, which had smaller percentage than the former by 10%. Following was the Food and Beverage with the proportion being just over one-fifth of the total. In this year the smallest proportion was for Video Games, making up 1% of the whole chart.
Regarding 2010, people purchasing for Electronics and Appliance went down by 5%. Similarly, there was a significant decrease in online shopping sales of Home Furnishings, comprising for 15%. On the contrary, the percentage of Video Games and Food and Beverage went up, at 23% and 32% respectively.
Overall, the largest section in the two years is different, with 2005 being the Electronics and Appliance sales and 2010 being the Food and Beverage
Top answer
) online shopping online for retail sectors in Canada in 2005 and 2009. Each chart is divided into 4 parts: The four categories are: Electronics and Appliance, Food and Beverage, Home furnishings and Video Games. In 2005, Electronics and Appliances section had the largest percentage of online sales, at 35% of the total.
- ) online shopping online for retail sectors in Canada in 2005 and 2009.
- Each chart is divided into 4 parts: The four categories are: Electronics and Appliance, Food and Beverage, Home furnishings and Video Games.
- In 2005, Electronics and Appliances section had the largest percentage of online sales, at 35% of the total.
- In second place on the chart was Home Furnishing s, which was 10% smaller .
- had smaller percentage than the former by 10%.
Get the Weekly English Kit 📬
New words, one handy idiom, and a 2-minute quiz — delivered to your inbox to keep your streak alive.
The two pie charts compare the sales in four categories of (It is the categories that are compared, not the total of all sales.) online shopping online for retail sectors in Canada in 2005 and 2009. Each chart is divided into 4 parts: The four cate
 Related Questions