
IELTS writing task 1 - Plz review it
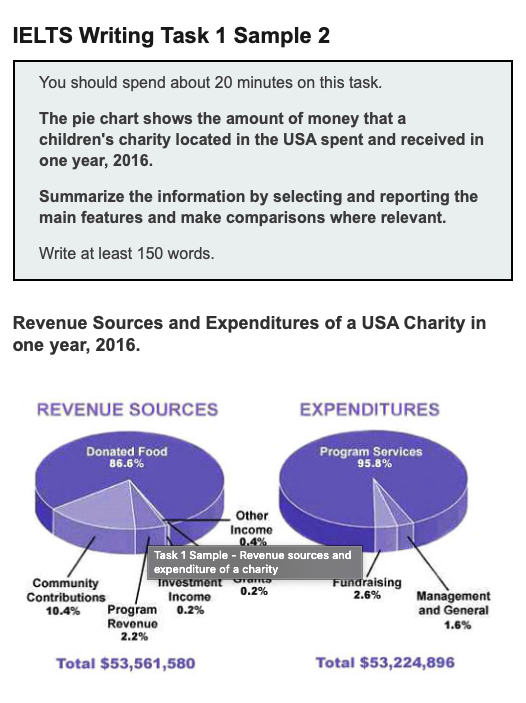
The pie chart gives information about how much money received and spent by an American Charity for children in 2016.
In general, what stands out is that a large proportion of the money received was in the form of donated food. However, the charity spent most of its funding on program services.
Regarding the revenue sources of the charity, 85.6% of that was donated food, which made up the highest proportion. The income that its community contributed accounted for about one eight of that of donated food, at about 10.4%. By contrast, the program revenue took up just 2.2%, about one fifth of that of community contributions. Investment income, government grants and other income, however, were below 1% in total.
Looking at the expenditures of this charity, while 95.8% of its spending was on program services, fundraising and management and general only made up tiny proportion, about 2.6% and 1.6% respectively.
Get the Weekly English Kit 📬
New words, one handy idiom, and a 2-minute quiz — delivered to your inbox to keep your streak alive.
 Related Questions