
IELTS Writing Task 1 - Please help review
Hi,
Please help review my writing below and give me percent as grade if possible. For example, 60% if it's bad, 80% if it's ok or more if you're really like it. Many thanks.
--
You should spend about 20 minutes on this task.
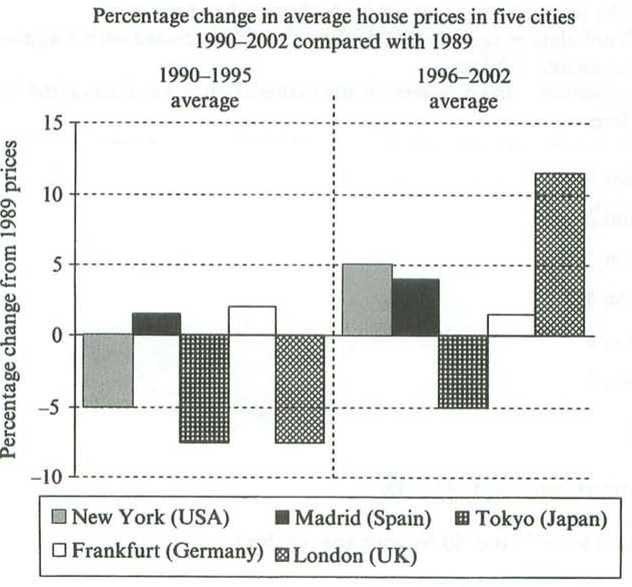
The chart below shows information about changes in average house prices in five different cities between 1990 and 2002 compared with the average house prices in 1989.
Summarize the information by selecting and reporting the main features, and make comparisons where relevant.
Write at least 150 words.
--
The bar chart illustrates how accommodation prices changed in the period from 1990 to 2002 of New York, Madrid, Tokyo, Frankfurt and London in comparison with year 1989.
At the first glance, it is clear that most of these cities, excluded Frankfurt, fluctuated considerably in prices of house from 1989 prices. Of all cities, London saw the biggest change in accommodation price.
In comparison with year 1989, between 1990 and 1995, New York, Tokyo and London house prices went down with 5% drop of New York and 7% decrease for these other 2 cities. Both accommodation in Madrid and Frankfurt slightly increased in these years, 2% and 3% respectively.
From 1996 to 2002, compared with 1989, house in London surged and reach its highest point of change at about 13%. Meanwhile, the rate of change in accommodations price of New York and Madrid also raised, to exactly 5% in New York and about 3% in Madrid. 5% is also how Tokyo house price decreased from 1989.
Top answer
There are many mistakes in your essay. ) of New York, Madrid, Tokyo, Frankfurt and London in comparison with year 1989. ) considerably in prices of house (wrong form) from 1989 prices.
- There are many mistakes in your essay.
- ) of New York, Madrid, Tokyo, Frankfurt and London in comparison with year 1989.
- ) considerably in prices of house (wrong form) from 1989 prices.
- Of all (missing word) cities, London saw the biggest change in accommodation price.
- In comparison with year 1989, between 1990 and 1995, New York, Tokyo and London house prices went down with (missing word) 5% drop of New York and (missing word) 7% decrease for these other 2 cities.
Get the Weekly English Kit 📬
New words, one handy idiom, and a 2-minute quiz — delivered to your inbox to keep your streak alive.
There are many mistakes in your essay.
The bar chart illustrates how accommodation (That is not what the chart shows.) prices changed in the period from 1990 to 2002 (There are 2 periods, not one.) of New York, Madrid, Tokyo, Frankfurt and London in comparison with year 1
 Related Questions