
[IELTS Writing Task 1] Please help me with this bar chart
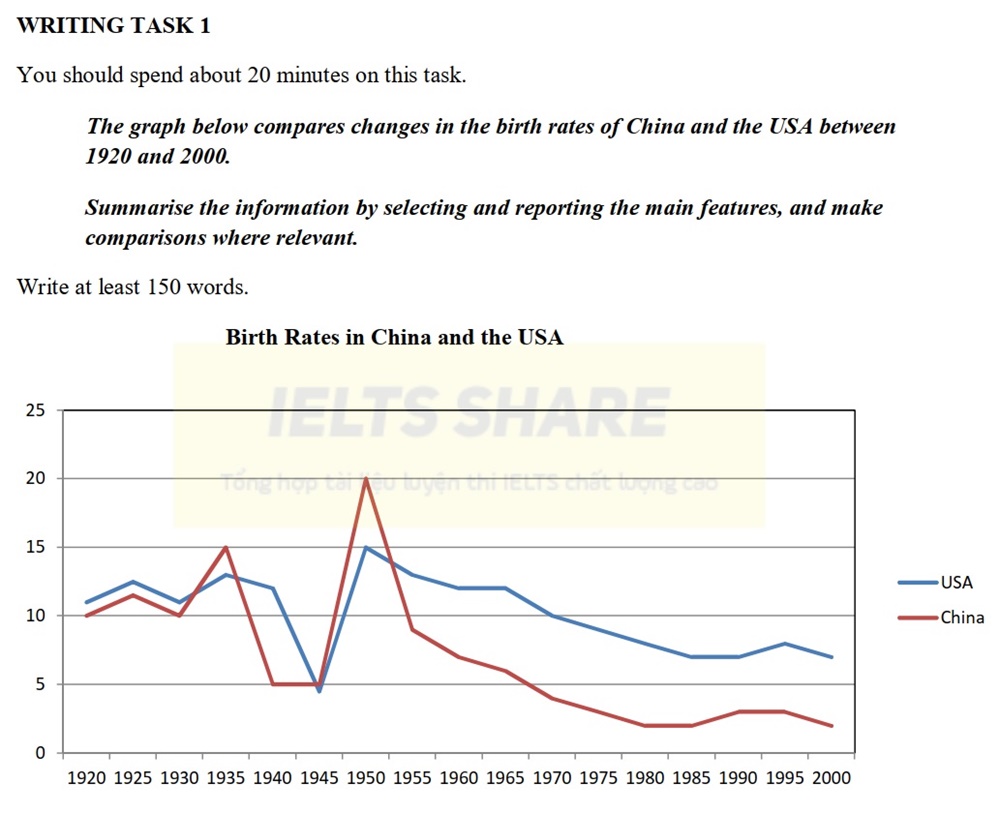
The bar chart shows the amount of Chinese and American children born during the period from 1920 to 2000.
Overall, it is clear that there were striking similarities between the fertility of two nations throughout the time given. Also, it is interesting to notice that while the two figures were comparable before 1950, after that time the gap between two birth rates became wider as the China’s figure slip away.
Starting at 10% in around 1920, China’s birth rate was fluctuating over the next 3 decades with a peak of 15% in 1935. After staying low at around 5% steadily from 1940 to 1945, the figure soared dramatically to its peak at 20% in 1950, and then kept declining for the rest of the period to just above 2% in 2000.
The birth rate of USA, meanwhile, also fluctuating from the start at 11%, followed by a steep fall which reached no more than 5% in 1945. Then, the USA witnessed a significant plunge in fertility, bringing the figure to its peak at 15% in 1950. Finally, similar to the China, USA’s birth rate gradually decreased to somewhere in the vicinity of 7% in 2000.
Top answer
The bar chart (incorrect) shows the amount (wrong word, incorrect description) of Chinese and American children born during the period from 1920 to 2000. Overall, it is clear that (Clear, evident, apparent, notable and obvious are opinion words. ) there were striking similarities between the fertility of two nations (incorrect ) throughout the time given.
- The bar chart (incorrect) shows the amount (wrong word, incorrect description) of Chinese and American children born during the period from 1920 to 2000.
- Overall, it is clear that (Clear, evident, apparent, notable and obvious are opinion words.
- ) there were striking similarities between the fertility of two nations (incorrect ) throughout the time given.
- Also, it is interesting to notice that while the two figures (wrong word) were comparable before 1950, after that time the gap between the two birth rates became wider as the China’s figure (wrong word) slip away .
- (wrong word, wrong form) Starting at 10% in around 1920, China’s birth rate was fluctuating (wrong word) over the next 3 decades with a peak of 15% in 1935.
Get the Weekly English Kit 📬
New words, one handy idiom, and a 2-minute quiz — delivered to your inbox to keep your streak alive.
The bar chart (incorrect) shows the amount (wrong word, incorrect description) of Chinese and American children born during the period from 1920 to 2000.
Overall, it is clear that (Clear, evident, apparent, notable and obvious are opinion words. Avoid opinions in Task
 Related Questions