
[IELTS writing task 1] Please help me to correct
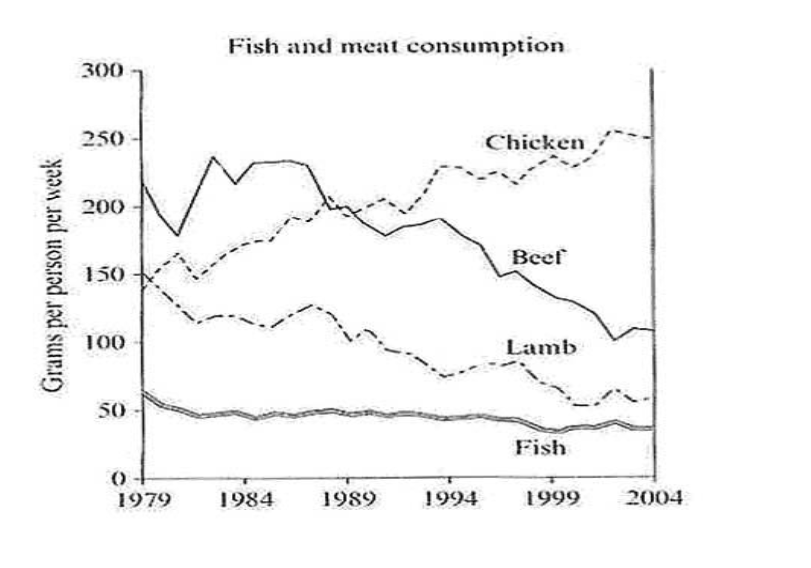
The graph below shows the consumption of fish and some different kinds of meat in a European country between 1979 and 2004.
Summarise the information by selecting and reporting the main features, and make comparisons where relevant.
The line graph show information about the amount of four different kinds of food consumed by a European country from 1979 to 2004.
It is noticeable that fish was the least commonly eaten meat throughout the period shown. while the consumption 'of beef and lamb decreased significantly, there was a fluctuating increase in the amount of chicken used.
In 1979, beef was the most popular kind of meat with almost 220 grams consumed per person per week. The figures for chicken and lamb were lower, at under 150 grams and exactly 150 grams. By contrast, only about 60 grams of fish was eaten in this year.
By 2004. although the amount of beef reached a peak of 1 about 240 grams in 1983, it fell steadily to just above 100 grams. By contrast, the country witnessed a significant rise in the consumption of chicken, increasing by approximately 100 grams over the period. While Lamb continued to decrease, finishing at just above 50 grams, the amount of fish eaten remained stable at around 50 grams.
Get the Weekly English Kit 📬
New words, one handy idiom, and a 2-minute quiz — delivered to your inbox to keep your streak alive.
 Related Questions