
[IELTS writing task 1] Please help me to correct
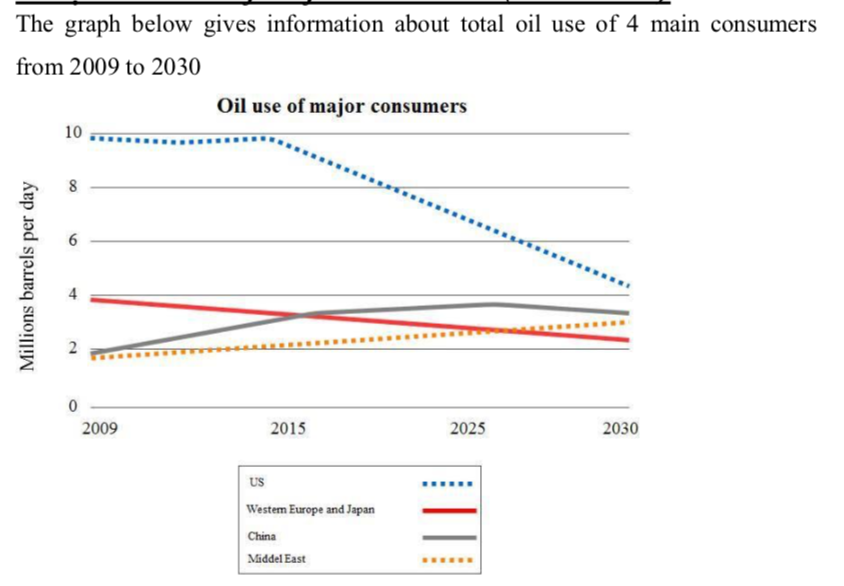
The line graph compares the total amount of oil utilized by the US, Western Europe and Japan, China, and the Middle East between 2009 and 2030
It is noticeable that while the use of oil in Western Europe and Japan, and the US are expected to fall over the period shown, the figures for China and the Middle East will increase. The US, in particular, is forecasted to experience the most dramatic fall in the amount of oil used.
Looking into the US and Western Europe, there were about 4 and 10 million barrels of oil consumed every day in 2009. While the figure for the latter fell steadily from 2009 to 2015, that of the US remained stable at just below 10 million barrels per day. However, whereas the data of Western Europe and Japan is projected to decrease gradually, the number of oil barrels used by American consumers will plummet by 6 million barrels, finishing at just above 4 millions by the year 2030.
Regarding China and the Middle East, there was a slight rise in the number of oil barrels used by Chinese and the Middle East consumers from just below 2 million to 3 million and to just above 3 million respectively. Although the figure for China showed a more significant increase, compared to the data of the Middle East, they are expected to make use of approximately 3 million barrels per day by 2030.
Top answer
Please read my advice for Task 1 essays: IELTS TASK 1: Hints, Tips And Advice The line graph compares the total amount of oil utilized (wrong word) by the US, Western Europe and Japan, China, and the Middle East between 2009 and 2030 (missing punctuation) That is not accurate or precise. You have to write something like this: The line graph compares the total amount of oil used in four geographic regions from 2009 to the present day, with a forecast up to 2030. The four regions are: the US, China, the Middle East and Western Europe and Japan.
- Please read my advice for Task 1 essays: IELTS TASK 1: Hints, Tips And Advice The line graph compares the total amount of oil utilized (wrong word) by the US, Western Europe and Japan, China, and the Middle East between 2009 and 2030 (missing punctuation) That is not accurate or precise.
- You have to write something like this: The line graph compares the total amount of oil used in four geographic regions from 2009 to the present day, with a forecast up to 2030.
- The four regions are: the US, China, the Middle East and Western Europe and Japan.
- The units of measure are millions of barrels per day.
- It is noticeable that while the use of oil in Western Europe and Japan, and the US are expected to fall over the period shown, the figures (wrong word) for China and the Middle East will increase.
Get the Weekly English Kit 📬
New words, one handy idiom, and a 2-minute quiz — delivered to your inbox to keep your streak alive.
Please read my advice for Task 1 essays: IELTS TASK 1: Hints, Tips And Advice
The line graph compares the total amount of oil utilized (wrong word) by the US, Western Europe and Japan, China, and the Middle East between 2009 and 2030 (missing punctuati
 Related Questions