
IELTS Writing Task 1 (please help me correct my essay)
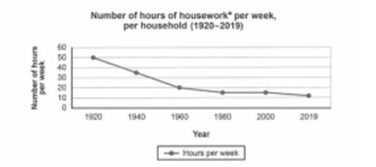
The chart below shows the changes in ownership of electrical appliances and amount of time spent doing housework in households in one country between 1920 and 2019.
Summarize by selecting and reporting the main features and make comparison where relevant.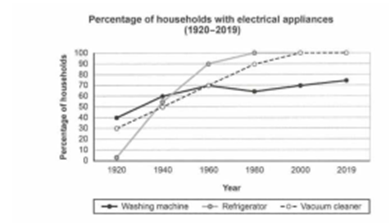
(the graphs are inserted)
Answer:
The chart details the percentage of electrical appliances in a country and the result of hours of doing domestic work in families during a 99-year period starting from 1920.
In general, the usage of washing machines, refrigerators, and vacuum cleaners increased sharply leading to a steady drop in the amount of time spent on undertaking housework.
In 1920, washing machine was the most common appliance that up to 40 percent of families chose to purchase. This number continued to rise up to 70 percent in 1960, then fall slightly in the next twenty years before rising again to finish the period at 73%. Vacuum cleaner started lower at 30 percent but rose dramatically until reaching the plateau at 100% in 1980. Refrigerators went through the most significant change when began at 0% then surged to 90% in 1960 and peaked at 100% since 1980.
As the number of electrical appliances grew, the hours of doing chores decreased accordingly. The implementation of technology has resulted in the drop in housekeeping time from 50 hours each week to 20 hours by 1960. After that, the decline was more gradual, reaching about 10 hours a week.
Get the Weekly English Kit 📬
New words, one handy idiom, and a 2-minute quiz — delivered to your inbox to keep your streak alive.
 Related Questions