
IELTS writing task 1 - Please help me correct my essay
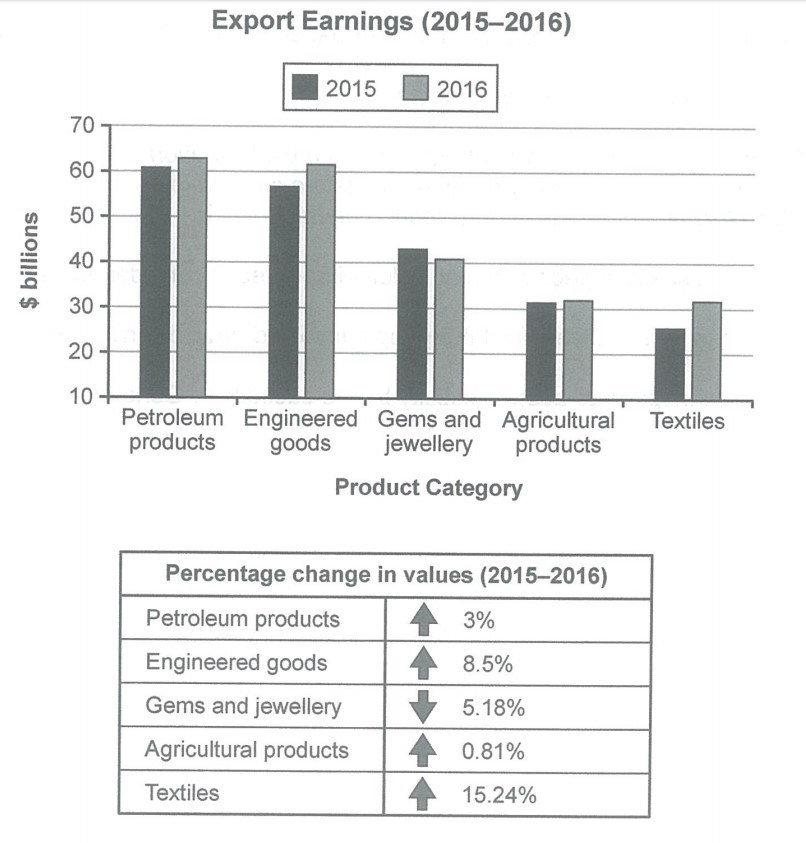
The chart below shows the value of one country’s exports in various categories during 2015 and 2016. The table shows the percentage change in each category of exports in 2016 compared with 2015.
Summarise the information by selecting and reporting the main features, and make comparisons where relevant.
-------------------------------------
The chart compares the earning money and the percentage variation of values by exported some categories in 2015 and 2016. These categories mentioned namely petroleum products, engineered goods, gems and jewelry, agricultural products, and textiles.
Overall, petroleum products, engineered goods, gems and jewelry earned more money than agricultural products and textiles. Moreover, the decreasing trend was observed in gems and jewelry while the opposite trend was observed in four other categories.
To begin with, petroleum products were the most valuable categories and exporting this category earned about 61 billion dollars in 2015. After that, the export earning peak to 64 billion dollars in 2016 and the change in value of petroleum products was 3% in percentage. Besides, the export turnover of engineered goods stood at 57 billion dollar in 2015 before went up to 63 billion dollar in 2016. The proportion change in value of engineered goods was 8.5%. Next, exporting agricultural products made about 31 billion dollars in 2015. In the next year, it increased to 32 billion dollars and the proportion of increasing value was 0.81%.
In addition, the export earning of textiles was 36 billion dollars in 2015, compared to itself was 31 billion dollars in 2016. The percentage change in value of textiles was the highest, at 15.24%. On the other hand, the changing value of textiles in both years was 5.18% in percentage and textiles’ earning money reduced from 44 billion dollars in 2015 to 41 billion dollars in 2016.
Top answer
I am sorry. I corrected my mistake in the last paragraph. Please review this essay below: --------------- The chart compares the earning money and the percentage variation of values by exported some categories in 2015 and 2016.
- I am sorry.
- I corrected my mistake in the last paragraph.
- Please review this essay below: --------------- The chart compares the earning money and the percentage variation of values by exported some categories in 2015 and 2016.
- These categories mentioned namely petroleum products, engineered goods, gems and jewelry, agricultural products, and textiles.
- Overall, petroleum products, engineered goods, gems and jewelry earned more money than agricultural products and textiles.
Get the Weekly English Kit 📬
New words, one handy idiom, and a 2-minute quiz — delivered to your inbox to keep your streak alive.
I am sorry. I corrected my mistake in the last paragraph. Please review this essay below:
---------------
The chart compares the earning money and the percentage variation of values by exported some categories in 2015 and 2016. These categories mentioned namely petroleum products, engineered goods, gems and jewelry, agricultural products, and textiles.
Overall, petroleum prod
The (What kind of chart?) chart compares the earning money (wrong expression. Money does not earn anything.) and the percentage variation of values by exported some categories (wrong expression. It makes no sense) in 2015 and 2016. These categories
 Related Questions