
IELTS writing task 1 - Please help me check
The prompt below:
The chart below shows the percentage of households in owned and rented accommodation in England and Wales between 1918 and 2011. Summarise the information by selecting and reporting the main features, and make comparisons where relevant.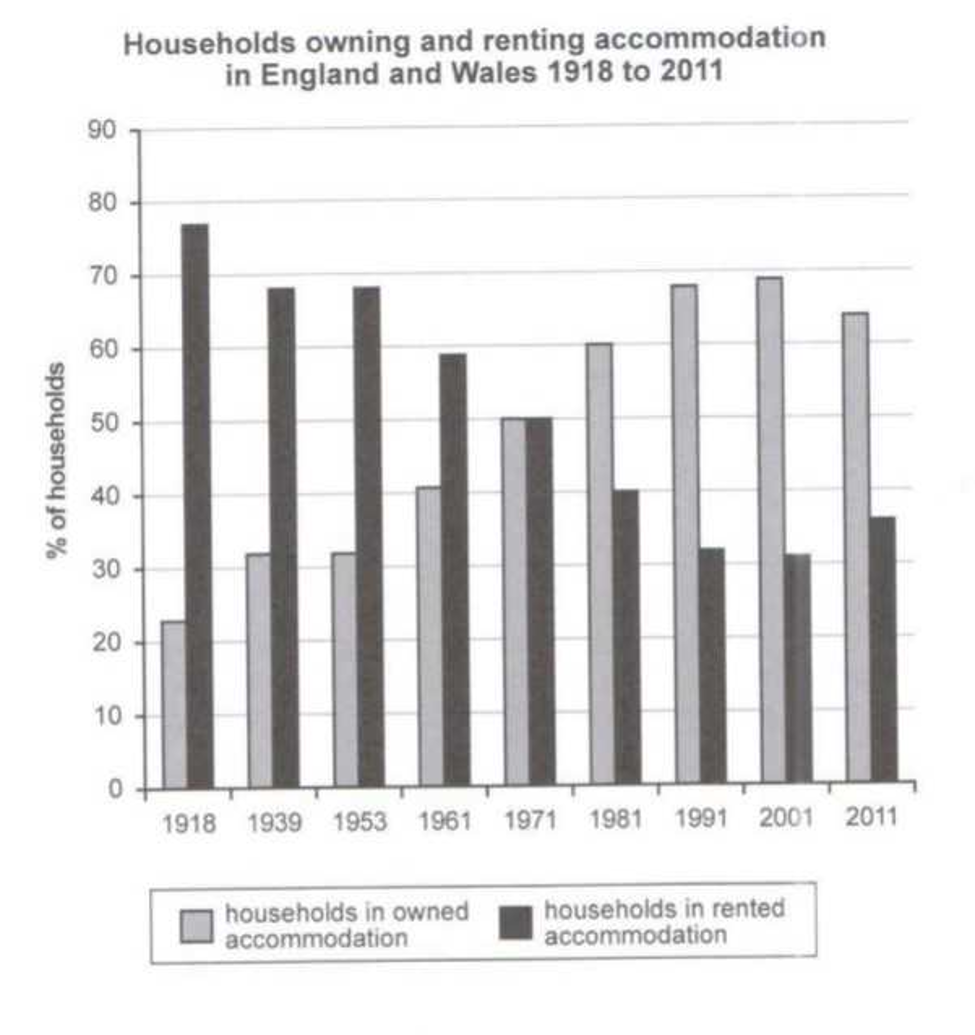
-----------
This is my essay
The bar chart compares the proportion of the English and Welsh families which bought houses and rented houses from 1918 to 2011.
Overall, almost English and Welsh households lived in rented house in 1918. For over 90 years, in 2011, more than 50 percent of population owned accommodation in English and Wales.
First of all, in 1981, the percentage of households in rented accommodation was the highest, nearly 80% and the percentage of households in owned accommodation was the lowest, at about 22%. Besides, there was a dramatic decrease in the households in rented house and a dramatic increase in the households in owned house in 1971. They had the same proportion was 50%.
Furthermore, in 2001, the percentage of families which owned house slightly grew but the figure for it was the highest, almost 70%. Also, the percentage of families which rented house was the lowest and stood at 31%. In the next year, the proportion of households in owned accommodation dropped to approximately 65%, while the proportion of households in rented accommodation rose somewhat around 35%.
Get the Weekly English Kit 📬
New words, one handy idiom, and a 2-minute quiz — delivered to your inbox to keep your streak alive.
 Related Questions