
IELTS Writing task 1 (Please help )
The line graph shows date about the amount of acid raid emissions that produced by four different sectors from 1990 to 2007.
It is clear that the amount of acid rain emissions in the UK was a significant decrease over a period of 17 years. Electricity, Gas and water supply dramatically declined.
In 1990, about 3.3 million tonnes of acid rain emissions of Electricity, gas and water supply. The Transport and communication took up about 0.7 million tonnes of emissions, while the Domestic produced 0.6 million tonnes. However, The Other inducstries accounting for the second largest amount of acid rain emissions around 2.1 million tones.
Emissions from Electricity, gas and water supply dramatically declined to only 0.5 million tonnes in 2007. While acid rain from dosmetic sector and other insductries went down significantly about 0.2 million tonnes for dosmetic and about 1.2 million tonnes for the other insductries. There was a slight increase of The Transport sector, 1 million tonnes in 2015.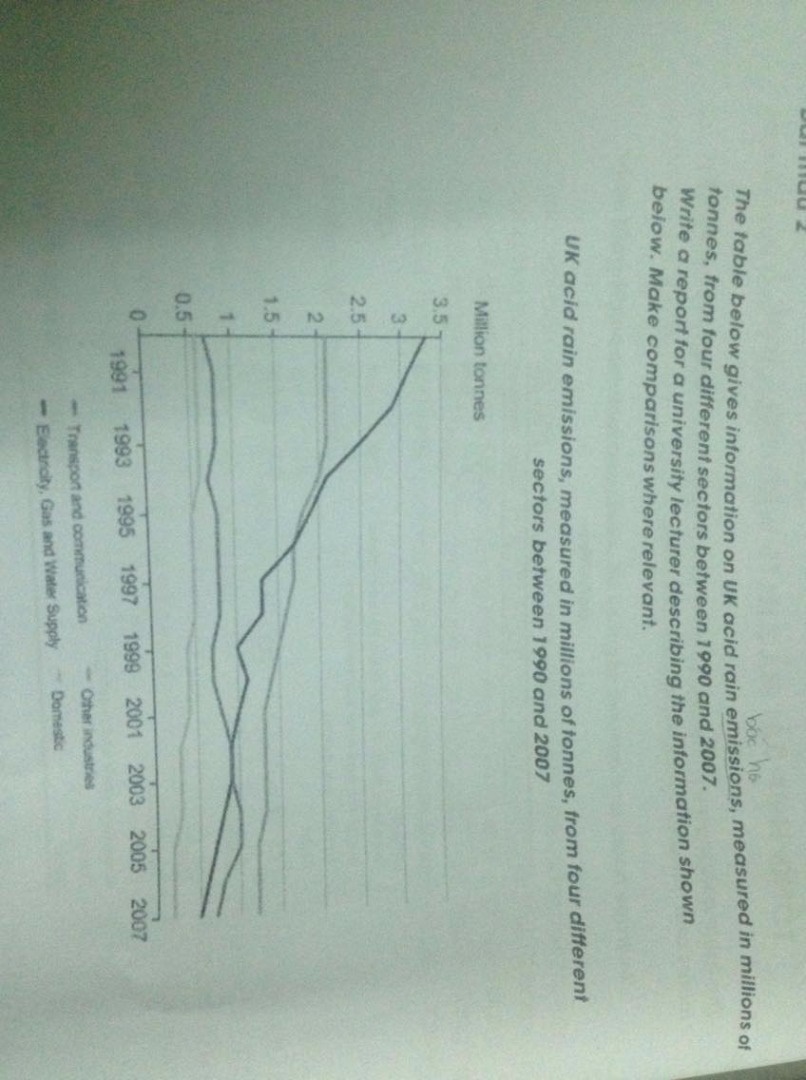
Top answer
The line graph shows date about the amount of acid raid emissions that (missing word) produced by four different sectors from 1990 to 2007. It is clear that the amount of acid rain emissions in the UK was a significant decrease (wrong usage) over a period of 17 years. Electricity, Gas and water supply dramatically declined.
- The line graph shows date about the amount of acid raid emissions that (missing word) produced by four different sectors from 1990 to 2007.
- It is clear that the amount of acid rain emissions in the UK was a significant decrease (wrong usage) over a period of 17 years.
- Electricity, Gas and water supply dramatically declined.
- 3 million tonnes of acid rain emissions of Electricity, gas and water supply.
- 6 million tonnes.
Get the Weekly English Kit 📬
New words, one handy idiom, and a 2-minute quiz — delivered to your inbox to keep your streak alive.
The line graph shows date about the amount of acid raid emissions that (missing word) produced by four different sectors from 1990 to 2007.
It is clear that the amount of acid rain emissions in the UK was a significant decrease (wrong usage) over a period of 17 years. Electricit
 Related Questions