
Ielts Writing task 1 - Please give me some advice on my writing
The bar chart gives information about the production and usage of electricity of the 10 highest ranking countries in 2014
Generally, it is obvious that China is the world leader in both production and consumption of electricity, and the second position is the United States. The two leading countries and the remaining countries clearly produced more than consumption, with exception of Germany ( the consumption is much more higher)
China is at the top of the list with energy generator and usage roughly 5,398 and 5,322, respectively. The second largest production and consumption is the United Stafes with the figures being 1000 billion kWh disparity.
Looking at the rest of countries, especially, in Russia ranking at the third place with a small difference about 20 billion kWh, and Germany, susprisingly, consuming 582.5 billion kWh higher than producing 526.6 billion kWh. Korea Republic has a half production and consumption of Japan with the number being 485.1 billion kWh and 449.5 billion kWh, respectively. In the seventh and eighth position have the similar amount of producing 550 billion kWh and consumprion of 450 billion kWh. Finally, in the fifth and sixth place, Canada producing and consuming nearly 200 billion kWh below India. 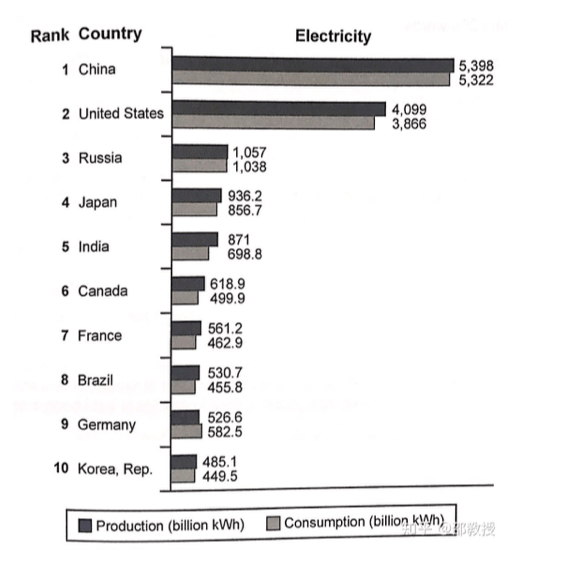
Top answer
The bar chart gives information about (That is very vague and imprecise. What information does it give? The fuels used?
- The bar chart gives information about (That is very vague and imprecise.
- What information does it give?
- The fuels used?
- The number of generating stations?
- The average of summer versus winter production?
Get the Weekly English Kit 📬
New words, one handy idiom, and a 2-minute quiz — delivered to your inbox to keep your streak alive.
The bar chart gives information about (That is very vague and imprecise. What information does it give? The fuels used? The number of generating stations? The average of summer versus winter production? Tell the reader exactly what is plotted.) the production and usage of electricity of the 10 highest ranking countries in 2014 (missing p
 Related Questions