
IELTS WRITING TASK 1. PLEASE GIVE COMMENTS.
The charts below show the percentage of water used for different purposes in six areas of the world.
Sumarise the information by reporting the main features, and make comparisons where relevant.
ANSWER
The proportion of water consumption for agriculture, industrial and domestic use in 6 areas are plotted on the pie charts.
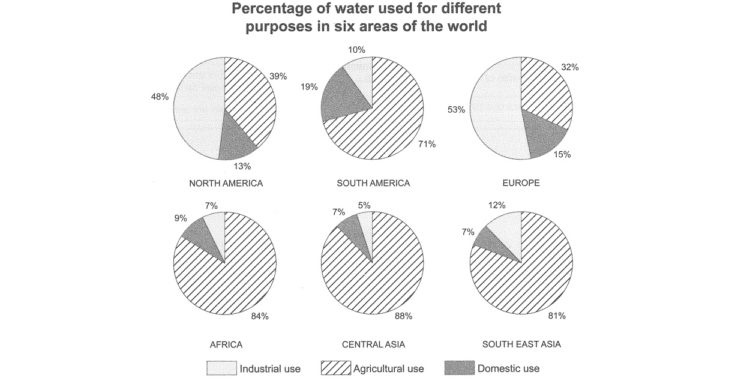
In most regions, agriculture use accounts for the majority of total water usage, with the exception of North America and Europe, each consumes at 39% and 32% respectively. In contrast, domestic water consumption takes up the smallest percentages in all areas.
Europe's percentage of industrial water consumption ranked first among all regions at 53%, 5% higher than that of North America, which ranks second. However, industrial sector percentage in other areas only constitutes for very percentage of water used, only ranges from 5% to 12%.
Regarding agriculture use, Africa, Central Asia and South East Asia usage are more than 80%, at 84%, 88% and 81% respectively while North America and Europe agriculture sector consumption are just 39% and 32%.
Domestic water usage ratio is highest in South America at 19%, followed by Europe and North America, each at 15% and 13%. However, it was much lower in the other three areas, which only have a mean percentage of 8%.
Top answer
) are plotted on the pie charts. (The proportion of water consumption for three uses, agriculture, industrial and domestic, are plotted on the pie charts. There are six pie charts, one each for five continents: Europe, Africa, North and South America and Asia.
- ) are plotted on the pie charts.
- (The proportion of water consumption for three uses, agriculture, industrial and domestic, are plotted on the pie charts.
- There are six pie charts, one each for five continents: Europe, Africa, North and South America and Asia.
- ) In most regions, agriculture use accounts for the majority of total water usage, with the exception of North America and Europ e, (comma splice area) each consumes at 39% and 32% respectively.
- In contrast, domestic water consumption takes up accounts for the smallest percentages in all areas.
Get the Weekly English Kit 📬
New words, one handy idiom, and a 2-minute quiz — delivered to your inbox to keep your streak alive.
The proportion of water consumption for agriculture, industrial and domestic use in 6 areas (This is not very precise.) are plotted on the pie charts. (The proportion of water consumption for three uses, agriculture, industrial and domestic, are plotted on the pie charts. There are six pie charts, one each for five continents: Europe, Af
 Related Questions