
IELTS WRITING TASK 1. PLEASE COMMENT.
ANSWER.
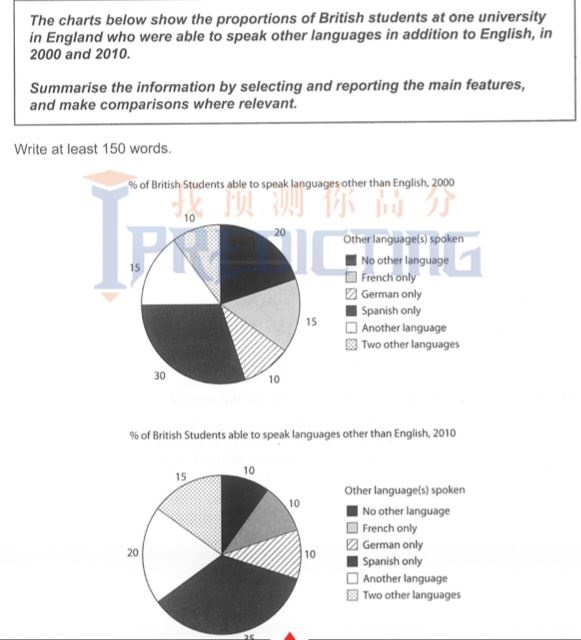
The percentages of British students who use different languages other than English are plotted on the pie charts. There are two charts, each for one year: 2001 and 2010.
The proportion of the group who speak Spanish accounted for the highest values in both time periods while the number of German speaking students took up the lowest percentages in both years at only 10%.
The proportions of Spanish speaking students increased by 5% in ten years from 30% to 35%. The same 5% increase rate of can also be seen in the categories of students who use a language not listed on the chart and use two languages not listed on the chart, from 15% to 20% and 10% to 15% respectively.
In contrast, the number of students who only speak English fell by 10% from 20% to 10% between 2001 and 2010. Similarly, French speaking group's value also dropped from 15% to 10%. However, Germany only group saw no change, maintained at 10% in both years.
Top answer
) languages other than English are plotted on the pie charts. There are two charts , each for one one showing the data for the year 2001 and the other for the year 2010. (You have not finished the description.
- ) languages other than English are plotted on the pie charts.
- There are two charts , each for one one showing the data for the year 2001 and the other for the year 2010.
- (You have not finished the description.
- You need to mention the six categories shown.
- ) The proportion of the group who speak Spanish accounted for the highest values in both time periods while the number of Germa n-s peaking students had the lowest percentages in both years at only 10%.
Get the Weekly English Kit 📬
New words, one handy idiom, and a 2-minute quiz — delivered to your inbox to keep your streak alive.
The percentages of British students who speak one or more different (Different is 'other than" It is incorrect to use both.) languages other than English are plotted on the pie charts. There are two charts , each for one one showing the data for the year 2001 and the other for the year 2010. (You have not finished the description. You
 Related Questions