
IELTS writing task 1: Pie charts about water usage
The pie charts below compare water usage in San Diego, California and the rest of the world
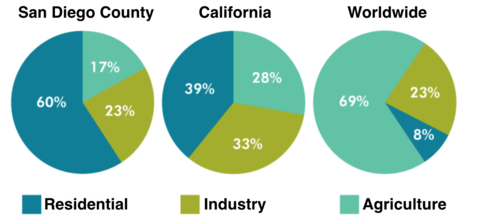
The charts show the percentages of water amount used for three main purposes namely residential, industry and agriculture in San Diego, California and the rest of the world.
It is clear that the greatest amount of water meets residential and industrial demands in San Diego and California. Meanwhile, the agricultural sector dominates global water usage.
As can be seen clearly, a massive 60% of the total water amount is used by households in San Diego, which is almost three-halves of the corresponding for California, at around 40%. By contrast, residential water usage stands at just below a tenth of the global total. However, the pattern is the complete reverse when it comes to agriculture. The majority (nearly 70%) of water consumption belong to worldwide, while the amount of water in use is significantly lower in San Diego and California, at 17% and 28% respectively.
Interestingly, California accounts for by far the highest level of water usage to serve industrial purposes, at about 30%. Also, the other two regions have an exactly equal proportion of industrial water use, with the figure being 10% lower compared to that of California.
Top answer
Please! I could really use some help with my essay.
- Please!
- I could really use some help with my essay.
Get the Weekly English Kit 📬
New words, one handy idiom, and a 2-minute quiz — delivered to your inbox to keep your streak alive.
 Related Questions