
IELTS WRITING TASK 1 : PIE CHARTS
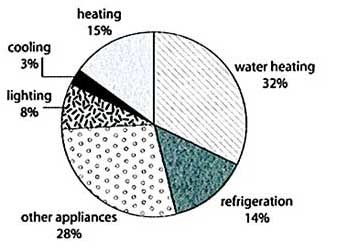
The first chart below shows how energy is used in an average Australian household. The second chart shows the greenhouse gas emissions which result from this energy use.
Summarize the information by selecting and reporting main features, and make comparisons where relevant.
Write at least 150 words.
My essay:
The first pie chart indicates how each family uses energy on average in Australia while the second one illustrates the greenhouse gas emissions released from this energy consuming.
Overall, while energy is used mostly in the heating process, greenhouse gas emissions are most generated from water heating. In comparison, cooling and lighting only take up small portion of both energy use and the carbon dioxide gas emitted.
Looking at the charts more closely, one can see that the amount of energy used for heating makes up the largest part at 42%, however, this process only produces 15% greenhouse gas emissions of the total. Next, an average household use three-tenth energy for water heating, which is roughly equal to its carbon dioxide release.
In addition, the proportion of greenhouse gases from fridge, lighting and other appliances use are around twice larger than their energy consumed. Meanwhile, each family use the least energy for cooling, which is at 2% compared to the total and the greenhouse gas emissions from this process takes up a minuscule portion of 3%.
(174 words)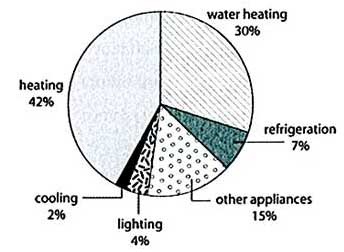
Top answer
The first pie chart indicates how each a typical family uses energy on average in Australia uses its electricity, while the second one illustrates the greenhouse gas emissions associated with the various appliances used at home . released from this energy consuming . Overall, while energy is used mostly in the heating the home and the water account for most of the electricity use, process, greenhouse gas emissions are most ly generated from water heating.
- The first pie chart indicates how each a typical family uses energy on average in Australia uses its electricity, while the second one illustrates the greenhouse gas emissions associated with the various appliances used at home .
- released from this energy consuming .
- Overall, while energy is used mostly in the heating the home and the water account for most of the electricity use, process, greenhouse gas emissions are most ly generated from water heating.
- In comparison, cooling and lighting only take up a small portion of both charts.
- energy use and the carbon dioxide gas emitted.
Get the Weekly English Kit 📬
New words, one handy idiom, and a 2-minute quiz — delivered to your inbox to keep your streak alive.
The first pie chart indicates how each a typical family uses energy on average in Australia uses its electricity, while the second one illustrates the greenhouse gas emissions associated with the various appliances
 Related Questions