
IELTS WRITING TASK 1 - PIE CHART - REASONS FOR USING PHONES
The chart shows the results of surveys in one African country asking teenagers the main reasons for using their phones between 2016 and 2019.
PLEASE HELP ME EVALUATE MY WRITING
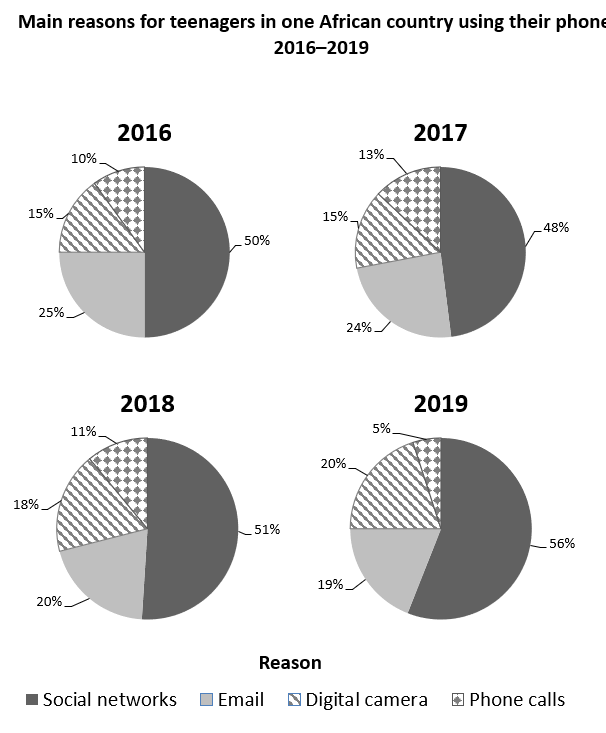
The four pie charts illustrate the reasons for mobile phone's usage of adolescents in an African nation in the years 2016, 2017, 2018, and 2019.
Overall, social networks made up the largest part of the chart throughout the given period, while the figures for phone calls were the smallest segment.
Usage for social networks accounted for half of the total usage in 2016, and experienced a negligible decrease of 2% in the next year before increasing slightly to 51% in 2018. This was followed by a growth to 56% in 2019. Email, which comprised a quarter of teenagers' usage in 2016, fell to 24% in 2017. In the following years, the figure continued to drop as it reached 20% and 19% in 2018 and 2019.
In 2016, the usage for digital camera was 15%, and it remained unchanged in the next year while the figure for phone calls went up to reach it peak at 13%. The figures for digital camera and those for phone calls followed opposite pattern over the last two years of the period as the former gradually rose to 20% and the latter decreased approximately twofold to 5% in 2019.
Get the Weekly English Kit 📬
New words, one handy idiom, and a 2-minute quiz — delivered to your inbox to keep your streak alive.
 Related Questions