
Ielts writing task 1: pie chart and table
The pie chart below shows the main reasons why agriculture land become less productive. The table shows how these causes affected three regions of the world during the 1990s.Summarise the information by selecting and reporting the main features and make comparisons where relevant.
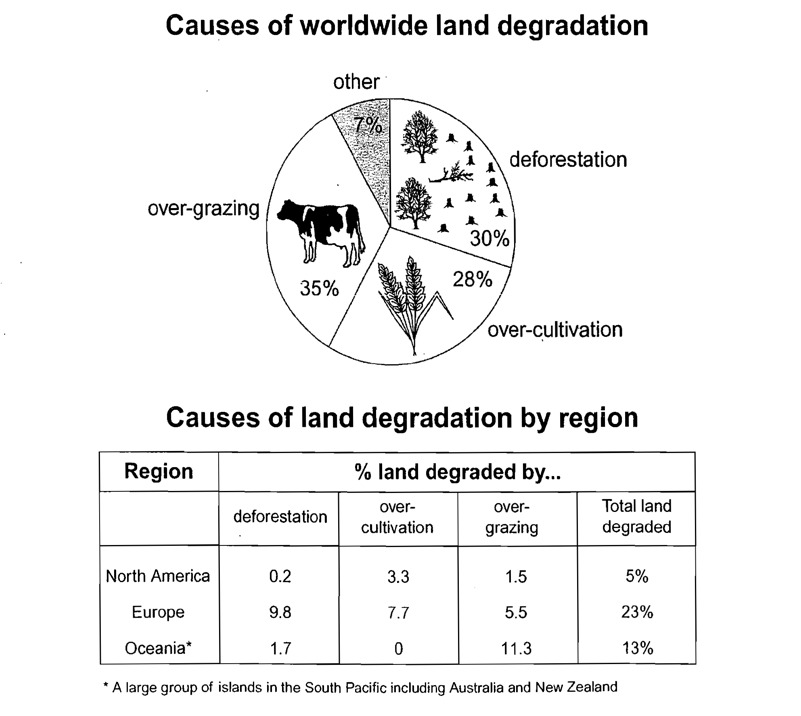
The two given charts show the information about a number of the main factors which lead to the land degradation in general and in 3 different areas in particular during the 1990s.
It is noticeable that the largest part over- grazing which is considered as a primary reason causing the decrease of land quality in the world. The table illustrates that Europe had far higher proprtion of unproductive land than North America and Oceania in 1990s.
The pie chart clearly shows that there is a large propotion of over-grazing over 35% in total. While deforestation and over-cultivation account for two smaller parts, 30% and 28% respectively. The smallest part is other fators accounting for 7% in total.
In term of the data in the table, it is easy to see that the principal element leading to the land deterioration in Europe is deforestation. This accounts for the massive 9.8%, while a mere 0.2% land in North America and 1.7% land in Oceania were destroyed by deforestation. Over-grazing accounts for the vast majority of the causes to the farmland decline in the large group of islands in the South Pacific, about 11.3%. By comparison with Europe and North America It causes only 5.5% and 1.5% land destroyed respectively. Over- cultivation part accounts for a lowest percentage of reasons compared with other areas.
Top answer
The pie chart below shows the main reasons why agriculture (wrong form) land become (wrong verb form) less productive. S ummarise (bad spacing) the information by selecting and reporting the main features and make comparisons where relevant. The two given charts show the information about a number of the main factors which lead to the land degradation in general and in 3 different areas in particular during the 1990s.
- The pie chart below shows the main reasons why agriculture (wrong form) land become (wrong verb form) less productive.
- S ummarise (bad spacing) the information by selecting and reporting the main features and make comparisons where relevant.
- The two given charts show the information about a number of the main factors which lead to the land degradation in general and in 3 different areas in particular during the 1990s.
- It is noticeable that the largest factor part (missing word) over- grazing (bad spacing) which is considered as to be a primary reason causing the decrease of land quality in the world.
- The table illustrates that Europe had (missing word) far higher proprtion of unproductive land than North America and Oceania in 1990s.
Get the Weekly English Kit 📬
New words, one handy idiom, and a 2-minute quiz — delivered to your inbox to keep your streak alive.
The pie chart below shows the main reasons why agriculture (wrong form) land become (wrong verb form) less productive. The table shows how these causes affected three regions of the world during the 1990s.Summarise (bad spacing) the i
The pie chart and table describe the reasons of destruction of farming land in three different areas in 1990s. Averagely over grazing has been known as a main cause of drop in productivity of agricultural land with devastating the 35% of agricultural area.
Over-grazing, over-cultivation- deforestation and other is introduced as a most important devastating parameters which decrease the b
 Related Questions