
IELTS WRITING TASK 1 PIE CHART
The following two pie charts show the results of a survey into the popularity of various leisure activities among European adults in 1985 and 1995.
Summarise the information by selecting and reporting the main features, and make comparisons where relevant.
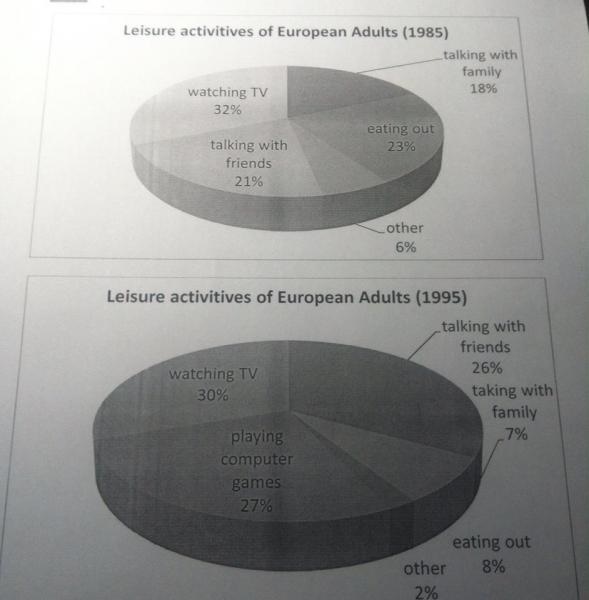
The two pie charts reveal how European spent their free time in the year 1985 and 1995.
Clearly, watching TV was the most enjoyable activity in both years, at 32% in 1985 and drop slowly to 30% in 1995. But the surprising increase for time invested in computer game was the most significant change. There was not a single one referred playing computer games being their favourite leisure activity but in 1995, this hobby raise the popularity to 27% - the second highest overall. And slightly below this was talking with friend at 26%, a rose from 21% in 1985. However, there was a rapidly decrease in the number of people choosing eating out as their preferred activities, from a high 23% to a low 8%. The same was also applied to talking with family, from nearly a quarter of proportion in 1985 to a small 7% in 1995.
After ten years, the time for indoor activities had rival that of outdoor activities. Combing watching TV with playing computer games in the year 1995, those two activities alone accounted for nearly above half of the chart. But this chart also experienced a significant drop of other kind of activities compared to the first chart.
Top answer
) 1985 and 1995. (Your first paragraph is not complete. How many types of free time are there?
- ) 1985 and 1995.
- (Your first paragraph is not complete.
- How many types of free time are there?
- What are they?
- ) Clearly, watching TV was the most enjoyable activity in both years, at 32% in 1985 and drop slowly (You cannot use slowly .
Get the Weekly English Kit 📬
New words, one handy idiom, and a 2-minute quiz — delivered to your inbox to keep your streak alive.
The two pie charts reveal how European (That is one person named "European.") spent their free time in the year (That is one year.) 1985 and 1995. (Your first paragraph is not complete. How many types of free time are there? What are they? Also, the survey does not include children.)
 Related Questions