
IELTS WRITING TASK 1 - PIE CHART
The charts below show the percentage of water used for different purposes in six areas of the world.
Summarise the information by selecting and reporting the main features, and make comparisons where relevant.
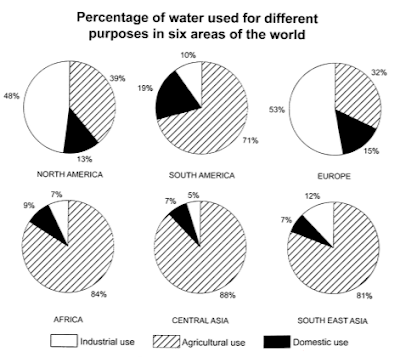
The proportion of water consumption for industrial, agricultural, and domestic purposes in six regions is given by the pie charts. Overall, it is noticeable that more water is used for agriculture in South America, Africa, Central Asia, and Southeast Asia while industry accounts for the vast majority of water used in North America and Europe.
Regarding the water consumed by agriculture in South America, this figure accounts for the highest at 71 percent. Similarly, these figures for this category are also the highest at more than four-fifths in Africa, Central Asia, and Southeast Asia. However, the percentage category of domestic use in South America is approximately 20 percent, which is more double than Africa and Asia (9% and 7%).
On the other hand, the vast majority of water usage in North America and Europe is for industrial use, which is nearly 50 percent as a whole. The percentages of water used for domestic purposes are about 15 percent in these areas, while the figure for agricultural use in North America (39%) is slightly higher than in Europe(32%).
(177 words)
Top answer
The pie charts outline the proportion s of water consumption used for industrial, agricultural, and domestic purposes in six region s. is presented in the pie charts. Overall, it is noticeable that more water is used for agriculture in South America, Africa, Central Asia, and Sout h-e ast Asi a, while industry accounts for the vast majority of water used in North America and Europe.
- The pie charts outline the proportion s of water consumption used for industrial, agricultural, and domestic purposes in six region s.
- is presented in the pie charts.
- Overall, it is noticeable that more water is used for agriculture in South America, Africa, Central Asia, and Sout h-e ast Asi a, while industry accounts for the vast majority of water used in North America and Europe.
- Regarding the water consumed by A griculture in South America , this figure accounts for the highest at 71 percen t of total water consumption .
- Similarly, these figures for this category are also the highest at more than four-fifths of water consumption in Africa, Central Asia, and Sout h-e ast Asia is used for agricultural purposes .
Get the Weekly English Kit 📬
New words, one handy idiom, and a 2-minute quiz — delivered to your inbox to keep your streak alive.
The pie charts outline the proportions of water consumption used for industrial, agricultural, and domestic purposes in six regions. is presented in the pie charts. Overall, it is noticeable that more w
 Related Questions