
IELTS WRITING TASK 1 - PIE CHART
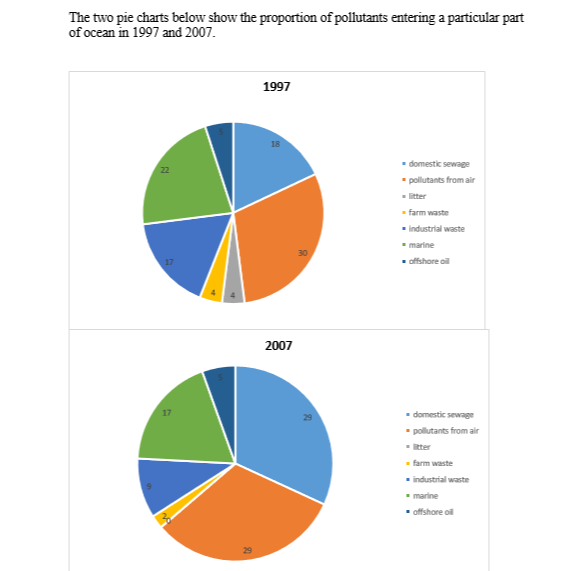
The pie charts illustrate the primary reasons leading to the pollution of ocean between 1997 and 2007.
At first glance it is clear that the main pollutant came from the air in 1997; however, the main factors of ocean pollution included both pollutants from air and domestic sewage in 2007.
Air pollutants accounted for 29% of pollutants entering a part of the ocean in 1997, and this figure was the same in 2007. Water released from the residential area had 18% in 1997, though the proportion of domestic sewage entering ocean was noticeably higher at almost a third after 10 years.
Another major factor polluting the ocean was the marine, with 22% in 1997 and only 17% in 2007.
The proportions of waste from industries were quite different between 1997 and 2007, at 17% and 9% respectively. The offshore oil remained at a very small amount in years given. The percentage of farm waste accounted for 4% in 1997, reducing to 2% ten years later. The litter had 4% at the beginning; however, it disappeared in 2007.
Top answer
Can you tell us where you found that question (and those charts) please? “Marine pollution” means ocean pollution. It is not a source of pollution!
- Can you tell us where you found that question (and those charts) please?
- “Marine pollution” means ocean pollution.
- It is not a source of pollution!
- I have used pollution from mining and logging instead in the edit below.
- Also, “a particular part of ocean” is unnatural.
Get the Weekly English Kit 📬
New words, one handy idiom, and a 2-minute quiz — delivered to your inbox to keep your streak alive.
Can you tell us where you found that question (and those charts) please? “Marine pollution” means ocean pollution. It is not a source of pollution! I have used pollution from mining and logging instead in the edit below. Also, “a particular part of ocean” is unnatural. It should be, e.g., “a particular ocean”.
The pie charts illustrate
 Related Questions