
IELTS Writing Task 1 Mixed graph
I heard that this kind of graph might appear in IELTS Task 1, hope you correct my writing!
-------------------------------
The charts below give information about travel to and from the UK, and about the most popular countries for UK residents to visit
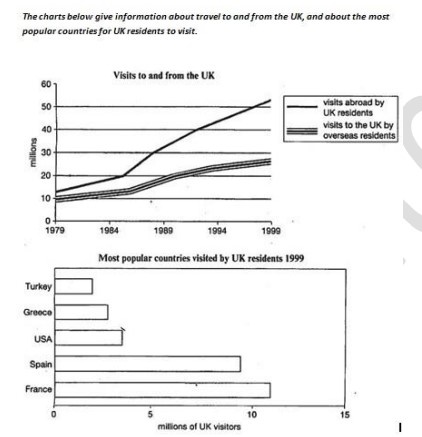
The line graph compares the number of UK visitors and the number of UK people who visited other countries from 1979 to 1999. The bar chart shows countries that were favored most by UK travellers in 1999.
In general, the amount of UK's overseas visitors and UK people travelling abroad both increased during the period. In addition, France and Spain had far more UK visitors compared with other countries in 1999.
In 1979, only 10 million foreign people visited the UK. However, this figure began to rise gradually as it almost reached 20 million in 1989 and nearly 30 million in 1999. Meanwhile, there were about 13 million UK residents visiting other countries in 1979. This number increased to 20 million in 1985 and from then it rose sharply to over 50 million in 1999.
In 1999, France was the most popular destination for UK travellers, with about 11 million of them visited this country. Spain, which had nearly 10 million visitors from the UK, was the second popular country for UK people. Three other countries: the USA, Greece and Turkey, only had about 4 million, 3 million and 2 million UK visitors, respectively.
Get the Weekly English Kit 📬
New words, one handy idiom, and a 2-minute quiz — delivered to your inbox to keep your streak alive.
Please attach an image that is easier to read and does not cause eyestrain!
The line graph compares the number of UK visitors (???) foreigners who visited the UK and the number of UK people who visited other countries from 1979 to 1999. The bar chart shows countries that had the hi
Sample essay (~190 words)
Note that the first main feature in the "overall" paragraph, the rising difference between the numbers in these two groups was elaborated in the "detail" paragraph..
The second main feature also had more information in the "detail" paragraph.
That lends coherence and cohesion to the essay.
The line graph and bar chart show numbers
 Related Questions