
[IELTS writing task 1 - line graph] Please review my essay
Hi AlpheccaStars,
I posted my IELTS writing task 1 essay in the wrong way so now I re-post it. Please help me to review it.
Thank you very much!
The following is my essay:
-------------------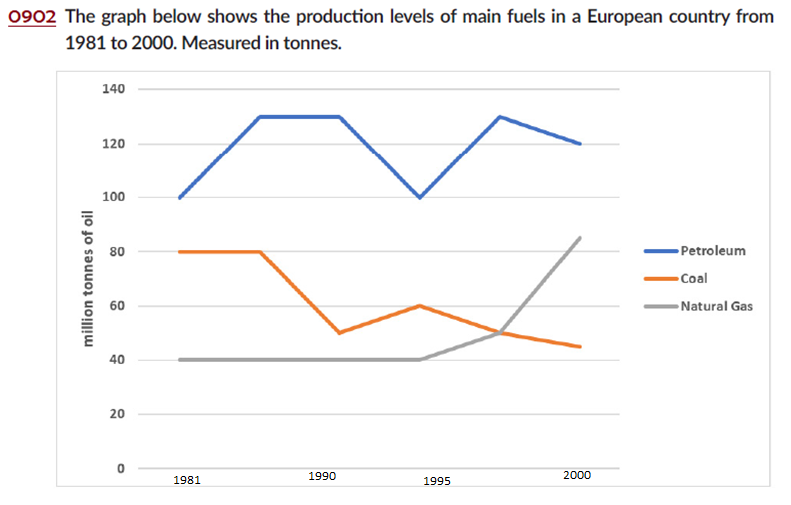
The line graph highlights data about the amounts of petroleum, coal and natural gas produced in a country in Europe between 1981 and 2000.
Overall, the amount of petroleum fluctuated, while those of coal and natural gas decreased and increased respectively. It is also noticed that natural gas was produced modest but saw a rapid rise at the end of the period.
In 1981, the amount of petroleum was highest with 100 million tonnes, compared to those of coal and natural gas with 80 million tonnes and 40 million tonnes respectively. Over the following 14 years, the amount of natural gas had no variation, whereas that of coal remained constant at 40 million tonnes for four years, but later decreased to 60 million in 1995. Meanwhile, production level of petroleum rose rapidly to 130 million and leveled off at that amount in the following 5 years before dropping dramatically to 100 million in 1995.
From 1995 to 2000, the amount of petroleum increased and reached a peak of at 130 million in 1997 and then fell to 120 million in 2000. At the same time, that of coal decreases by 15 million during this period. However, there was a rapid increase in the production of natural gas from 40 million to 85 million.
Top answer
Please read my Task 1 advice: IELTS TASK 1: Hints, Tips And Advice The line graph highlights (wrong word) data about (Vague, imprecise. ) the amounts of petroleum, coal and natural gas produced in a country in Europe between 1981 and 2000. Model: The line graph plots the tonnage of three different fuels, petroleum, coal and natural gas, produced in a European country from 1981 to 2000.
- Please read my Task 1 advice: IELTS TASK 1: Hints, Tips And Advice The line graph highlights (wrong word) data about (Vague, imprecise.
- ) the amounts of petroleum, coal and natural gas produced in a country in Europe between 1981 and 2000.
- Model: The line graph plots the tonnage of three different fuels, petroleum, coal and natural gas, produced in a European country from 1981 to 2000.
- Overall, the amount of petroleum production varied by 30% fluctuated , while those of coal and natural gas decreased and increased respectively.
- It is also noticed that Na tural gas volumes were constant until 1995, and then rose steeply in the last five years.
Get the Weekly English Kit 📬
New words, one handy idiom, and a 2-minute quiz — delivered to your inbox to keep your streak alive.
Please read my Task 1 advice: IELTS TASK 1: Hints, Tips And Advice
The line graph highlights (wrong word) data about (Vague, im
 Related Questions