
IELTS WRITING TASK 1 ( Line Graph). I don't have anyone to help me correct the essay. Could someone kindly check it, please? If it's possible, may you give me a mark? Thank you so much!
The chart below gives information about the percentage of overweight men and women in Australia from 1980-2000. Summarize the information by selecting and reporting the main features and make comparisons where relevant.
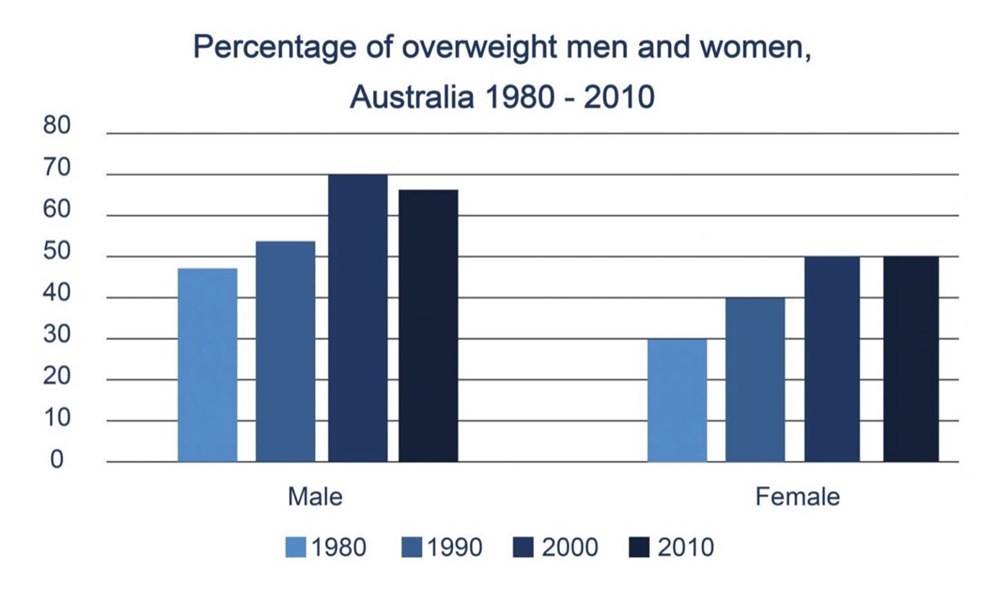
The bar chart compares the proportion of males and females who are overweight in Australia over the thirty-year period, 1980 to 2010.
Overall, there was a rise in the percentage of both genders. In addition, the proportion of obese men was more than women throughout the period.
In 1980, the number of overweight men was nearly 50%, compared to just one-third of women. Then, over the next twenty years, the proportion of men being overweight increased quickly and reached its highest point of 70% in 2000. A similar trend was seen in the group "Female" that went up gradually to 50% in 2000.
After rising to 70% in 2000, there was a slight decline in the category "Male" in 2010, by merely 3%. However, between 2000 and 2010, the proportion of females who were obese remained steady at 50%. Generally, the average percentage of overweight males in Australia was 17% higher than the percentage of overweight females over the period.
Top answer
The bar chart compares the proportion of males and females who are (wrong tense. ) in 1980, 1990, 2000 and 2010. Overall, there was a rise in the percentage of people who were overweight, the only exception being between 2000 and 2010 where it was equal for women, and slightly less for men.
- The bar chart compares the proportion of males and females who are (wrong tense.
- ) in 1980, 1990, 2000 and 2010.
- Overall, there was a rise in the percentage of people who were overweight, the only exception being between 2000 and 2010 where it was equal for women, and slightly less for men.
- both genders .
- (unnatural) In addition, the proportion of obese men was more than women.
Get the Weekly English Kit 📬
New words, one handy idiom, and a 2-minute quiz — delivered to your inbox to keep your streak alive.
The bar chart compares the proportion of males and females who are (wrong tense. The data is from the past.) overweight in Australia over the thirty-year period, (That is for line graphs with continuous data.) in 1980,
 Related Questions