
IELTS WRITING TASK 1 ( Line Graph). I don't have anyone to help me correct the essay. Could someone kindly check it, please? If it's possible, may you give me a mark? Thank you so much!
The chart below gives information about car ownership in the UK from 1975 to 2005 (percentage). Summarize the information by selecting and reporting the main features and make comparisons where relevant.
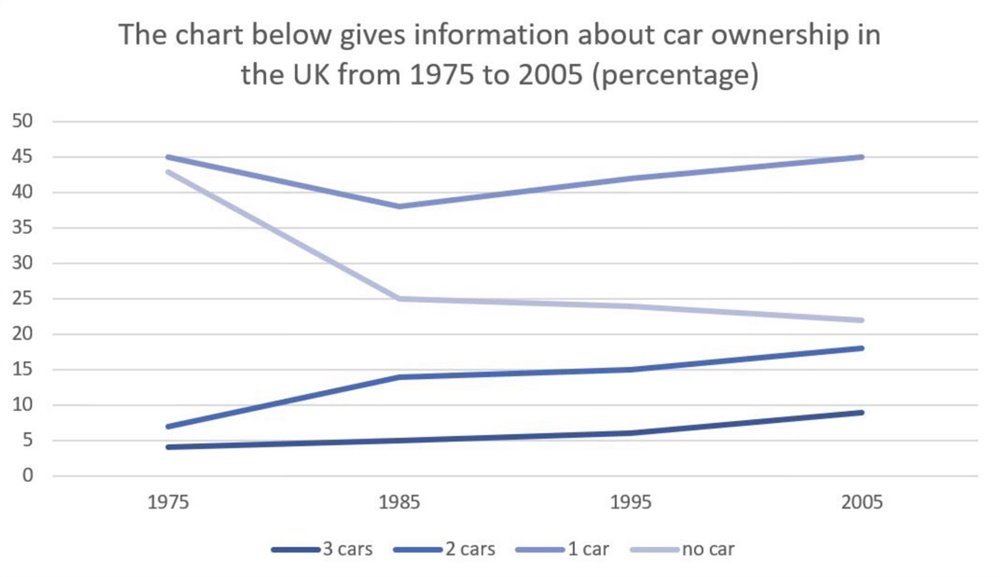
The given line graph shows the percentage of people who owned cars in the United Kingdom over a thirty-year period between 1975 and 2005.
Overall, the proportion of individuals possessing one car dominated in a total of four groups, while the percentage of people who did not own any car went down. In addition, there was an upward trend in the groups "2 cars" and "3 cars".
From 1975 to 1985, the proportion of both groups "1 car" and "no car" showed a downward trend. Specifically, despite being the first place, people who had just one car still reduced from 45% to 38%. The second place was the percentage of people who did not have any car also declined by nearly a fifth, from 43% to 25%. By contrast, the two groups left (3 cars and 2 cars) went up gradually, at 5% and 14% respectively.
Between 1985 and 2005, the group "1 car" still held the highest rank, grew by 7%, whereas the group "no car" continued to drop at approximately 22%. However, there was a slight rise in the proportion of individuals possessing two cars, from 14% to 18%. A similar trend was seen in the group "3 cars" that increased steadily to 9%. Generally, the number of people owning 1–3 cars in 2005 (50%) was 37% higher than in 1975 (13%).
Top answer
This is the fourth time I have asked you to post in the "essay" forum. Please post essays, paragraphs, dialogues and other writing in the essay forum so a moderator does not have to move your post. Click on this link: Next, tap on the green button "write a new post"
- This is the fourth time I have asked you to post in the "essay" forum.
- Please post essays, paragraphs, dialogues and other writing in the essay forum so a moderator does not have to move your post.
- Click on this link: Next, tap on the green button "write a new post"
Get the Weekly English Kit 📬
New words, one handy idiom, and a 2-minute quiz — delivered to your inbox to keep your streak alive.
This is the fourth time I have asked you to post in the "essay" forum.
Please post essays, paragraphs, dialogues and other writing in the essay forum so a moderator does not have to move your post. Click on this link:
Next, tap on the green button "write a new post"
The given (Unnecessary and awkward. Delete) line graph shows the percentage of people who owned cars in the United Kingdom over the thirty-year period, between 1975 to and 2005.
The opening paragraph is inadequate. You did not write that there are four
Apparently, some person, who failed all of their math classes, edited a task for this same subject.
https://www.englishforums.com/English/CouldReviewIeltsWritingTask-Essay/bpxbgm/post.htm
The original has problems, too, because the cu
 Related Questions