
Ielts Writing Task 1 - Line Graph - Heating Fuel Choice?
This is my essay for IELTS Writing Task 1. I would be grateful if someone here could provide some comments.
Ielts Writing Task 1 - Line Graph - Heating Fuel Choice?
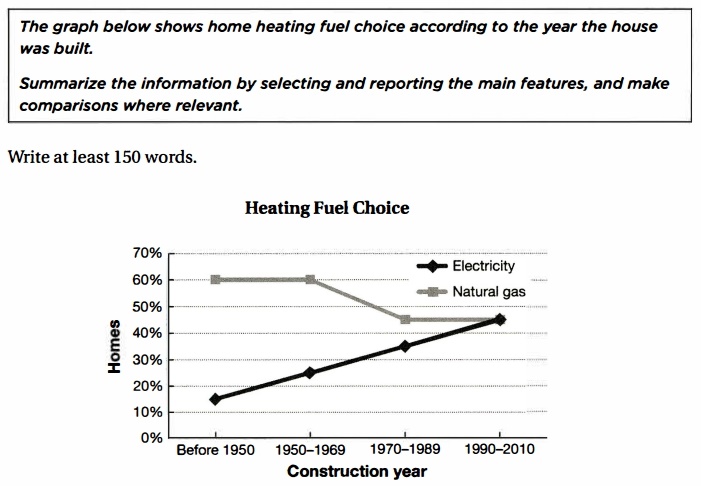
The line graph shows how many houses chose two ways for fuel heating over four periods of year the house was built from before 1950 to 2010. Throughout the year, natural gas seemed to be preferred.
The percentage of homes using electricity to heat fuel increased steadily. 15% of houses built before 1950 chose this way for fuel heating. This number grew by 10% when it came to the period of year 1950-1969. Another growth can be seen from the graph - around 35% of houses constructed between 1970 and 1989 made fuel be heated by the electric. This percentage reached the highest of 45% in the construction year of 1990-2010.
The number of houses built from before 1950 to 1969 and using another option - natural gas for heating fuel was far more than those constructed in the same period, with a percentage of 60%. This number dropped to 45% in the next period of year and remained the same until 2010, which was equal to the percentage of homes choosing electricity.
(173 words)
Top answer
The line graph shows how many houses chose two ways for fuel heating over four periods of year the house was built from before 1950 to 2010. (This is not a good sentence. 1.
- The line graph shows how many houses chose two ways for fuel heating over four periods of year the house was built from before 1950 to 2010.
- (This is not a good sentence.
- 1.
- Houses do not make choices.
- 2.
Get the Weekly English Kit 📬
New words, one handy idiom, and a 2-minute quiz — delivered to your inbox to keep your streak alive.
The line graph shows how many houses chose two ways for fuel heating over four periods of year the house was built from before 1950 to 2010. (This is not a good sentence. 1. Houses do not make choices. 2. They did not choose two ways of heating. Only one type of heating system was chosen. 3. "Over four periods of year" is ungrammatical.
Please re-write your opening sentence.
 Related Questions