
IELTS Writing Task 1 - Line graph (Food price)
It would be really nice if someone could give a me an estimated band score.
Thank you.
The graph below shows relative price changes for fresh fruits and vegetables, sugars and sweets, and carbonated drinks between 1978 and 2009.
Summarise the information by selecting and reporting the main features, and make comparisons where relevant.
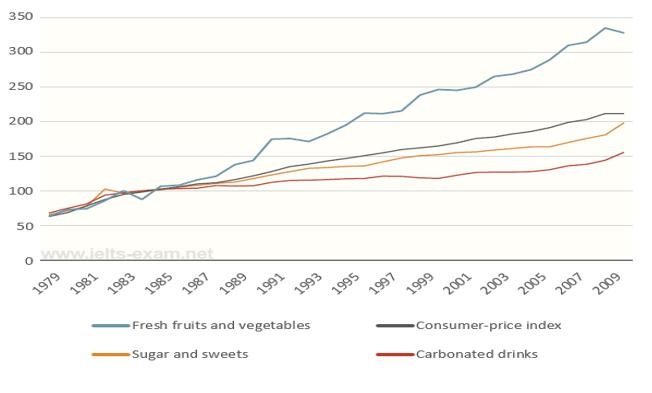
The graph compares prices for 3 food groups (fresh fruits and vegetables, sugar and sweets, and carbonated drinks) in the period from 1978 to 2009.
Overall, it can be seen that prices for the 3 groups followed a same trend of a general increase, despite some slight fluctuations. In addition, it is clear that for most of years, price for fresh fruits and vegetables was higher than the other 2 groups’.
In 1979, prices for the 3 food groups were at the same starting figure of about 60. Throughout the period, prices for sugar and sweets, and carbonated drinks kept increasing steadily. Despite that, these prices were consistently below aveage price for the 3 groups. By 2009, price for sugar and sweets hit peak at 200, almost 3 times higher than in 1979.
By contrast, price for fresh fruits and vegetables increased much more sharply, particularly from 1987. By the end of the period, it reached 300, roughly 6 times higher than the starting point of 60.
(167 words).
Top answer
The graph compares prices (That is not correct. It does not compare prices at all. It compares how much the prices changed relative to each other and the CPI.
- The graph compares prices (That is not correct.
- It does not compare prices at all.
- It compares how much the prices changed relative to each other and the CPI.
- ) for 3 food groups (fresh fruits and vegetables, sugar and sweets, and carbonated drinks) in the period from 1978 to 2009.
- Overall, it can be seen that prices for the 3 groups followed a same trend of a general increase, despite some slight fluctuations.
Get the Weekly English Kit 📬
New words, one handy idiom, and a 2-minute quiz — delivered to your inbox to keep your streak alive.
The graph compares prices (That is not correct. It does not compare prices at all. It compares how much the prices changed relative to each other and the CPI. ) for 3 food groups (fresh fruits and vegetables, sugar and sweets, and carbonated drinks) in the period from 1978 to 2009.
Overall, it can be seen that prices for the 3 groups followed a same trend of a general inc
 Related Questions