
Ielts writing task 1: line graph
The line graph illustrates the waste production by three different companies from 2000 to 2015.
Overall, the amounts of waste produced by company C experienced a significantly increase, while the waste output by company A and B both fell. At first, company A produced the largest amount of waste but at the end of the period, company C became the biggest producer.
In 2000, the waste production by company A and B were around 12 tonnes and 8 tonnes respectively. Then, the waste output by company B continued to increased sharply in 2005 reaching almost 10 tonnes of waste. However, at the end of the period, it dramatically dropped to 3 tonnes of waste and became the smallest producer.
On the other hand, company C started off as the smallest producer (about 3 tonnes) in 2000 after which this figure rosed sharply to around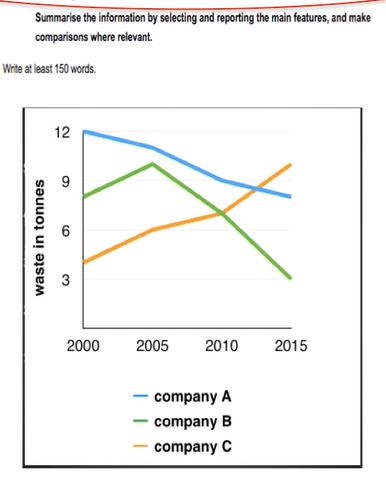
12 tonnes and became the biggest producer among these two companies.
Top answer
Please post essays, paragraphs, dialogues and other writing in the essay forum so a moderator does not have to move your post. htm You did not include the essay instructions. Are these the instructions?
- Please post essays, paragraphs, dialogues and other writing in the essay forum so a moderator does not have to move your post.
- htm You did not include the essay instructions.
- Are these the instructions?
- The graph below shows the amounts of waste produced by three companies over a period of 15 years.
- Please read my advice for Task 1 essays: IELTS TASK 1: Hints, Tips And Advice Vocabulary Words For Task 1: Reference Post
Get the Weekly English Kit 📬
New words, one handy idiom, and a 2-minute quiz — delivered to your inbox to keep your streak alive.
Please post essays, paragraphs, dialogues and other writing in the essay forum so a moderator does not have to move your post.
https://www.englishforums.com/English/EssayReportCompositionWriting/Forum9.htm
You did not include the essay instructi
The line graph illustrates (Not a good word choice. Read my advice) the waste production by three different companies from 2000 to 2015. (Incomplete. What are the company names?)
Overall, the amounts of waste produced by company C experienced (Not a good word choice. Read my ad
Sample:
The line graph compares the waste production, in tonnes, of three companies, A, B and C, from 2000 to 2015.
Overall, the total amount of waste generated decreased over the period. Cuts by Companies A and B were offset by a large increase in Company C. In 2000, Company A produced the most, followed by B and C. The order was quite different in 2015, with Company C
 Related Questions