
Ielts writing task 1 - Line Graph
Thank you a lot for giving comment about my writing. I know this still have lots of mistakes. Hope you have a good day.
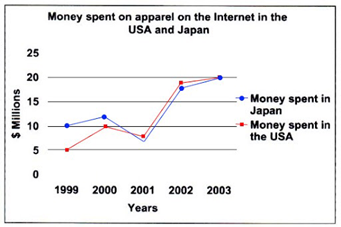
The line graph compares and contrasts the expenditure of purchasing clothes online measured in million dollars in Japan and America between 1999 and 2003.
Overall, spending on apparel by both nations' consumer fluctuated throughout the period. Moreover, the figure for the US overtook that for their counterpart after 2001.
In 1999, Japanese consumers spent $10 million on clothes, compared to only $5 million for Americans. By 2000, there was a slight increase of around $11 million in the expenditure of online clothing in Japan before continuing to hit a low of over $5 million in 2001. Like Japan, the pattern of this country was also repeated in the USA whose consumption expenditure grew marginally to $10 million in 2000. Then, this country paid out the same amount of money on online clothing, which fell to its lowest point of around $7 million in that year.
In the year 2002, the clothing‘s consumption of America soared up to around 16%, a bit higher than that of Japan. Afterward, the figure for both nations reached a peak of $20 million at the end of the period.
Top answer
spaceonme Thank you a lot for giving comment s on about my writing. I know this still has have lots of mistakes. Please read my advice for Task 1 essays.
- spaceonme Thank you a lot for giving comment s on about my writing.
- I know this still has have lots of mistakes.
- Please read my advice for Task 1 essays.
- They cover the words you use improperly.
- ) soar (Do not use "drama" words in math and science writing) IELTS TASK 1: Hints, Tips And Advice Vocabulary Words For Task 1: Reference Post
Get the Weekly English Kit 📬
New words, one handy idiom, and a 2-minute quiz — delivered to your inbox to keep your streak alive.
spaceonmeThank you a lot for giving comments onaboutmy writing. I know this still hashavelots of mistakes.
Please read my advice for Task 1 essays. They cover the words you use improperly.
fluctuate (There are no fluctuations on this graph.)
fi
The line graph compares and contrasts the amounts of money (in millions of dollars) used to purchase expenditure of purchasing clothes online measured in million dollars in Japan and America between 1999 and 2003.
The highlighted expressions are poor En
 Related Questions