
IELTS WRITING TASK 1 - LINE GRAPH
Hello, this is my ielts essay, can you help me grade it?
Topic: You should spend about 20 minutes on this task.
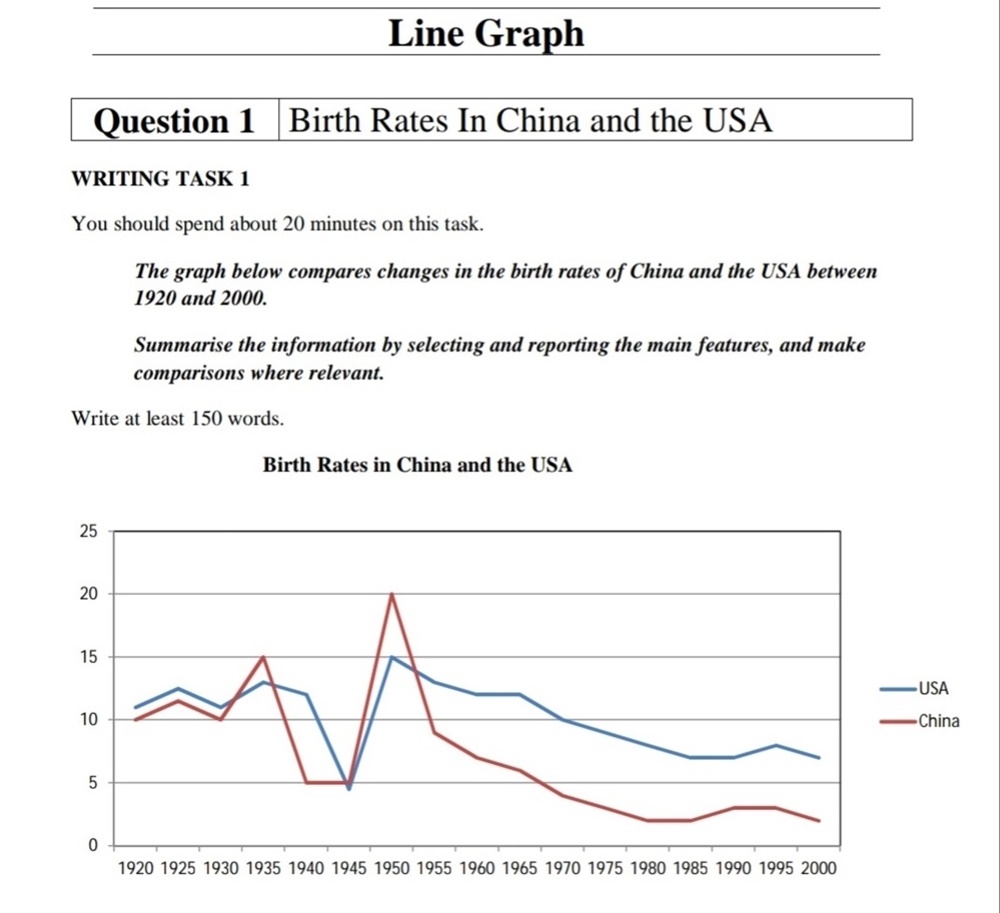
The graph below compares the changes in the birth rates of China and the USA between 1920 and 2000.
Summarise the information by selecting and reporting the main features and make comparisons where relevant.
Write at least 150 words.
--------------------------------
The line graph illustrates how birth rates in two different countries (China and the USA) changed during the period from 1920 to 2000.
Overall, the birth rates of both countries experienced a significant fluctuation throughout the period shown. It is noticeable that, US fertility was higher than that of China.
In the year 1920, the percentage of births that happened
during a period of time fluctuated around 12 percent in the US, while China's birth rate saw a slightly lower than, at 10 percent. In 1935, fertility in China overtook US, at 15 percent, but then decreased dramatically to 5 percent after five years. Similarly, the US saw a considerable decline from 14 percent to 4 percent.
From 1950 to 2000, the number of individuals born per year in China reached a peak of 20 percent after remaining almost unchanged between 1940 and 1945. Also, the US climbed rapidly to 15 percent. The latter half of the century, however, both nations brought a steady fall.
/data/user/0/com.samsung.android.app.notes/files/clipdata/clipdata_bodytext_210720_233909_046.sdocx->
Top answer
Please post essays, paragraphs, dialogues and other writing in the essay forum so a moderator does not have to move your post. htm Next, tap on the green button "write a new post" Please read my advice for Task 1 essays. IELTS TASK 1: Hints, Tips And Advice Vocabulary Words For Task 1: Reference Post
- Please post essays, paragraphs, dialogues and other writing in the essay forum so a moderator does not have to move your post.
- htm Next, tap on the green button "write a new post" Please read my advice for Task 1 essays.
- IELTS TASK 1: Hints, Tips And Advice Vocabulary Words For Task 1: Reference Post
Get the Weekly English Kit 📬
New words, one handy idiom, and a 2-minute quiz — delivered to your inbox to keep your streak alive.
Please post essays, paragraphs, dialogues and other writing in the essay forum so a moderator does not have to move your post. Click on this link:
https://www.englishforums.com/English/EssayReportCompositionWriting/Forum9.htm
Next, tap on t
The line graph compares the illustrates how (Illustrate is for diagrams, flow charts and pictures. Not for plots.) birth rates in two different countries (China and the USA) changed during the period from 1920 to 2000.
Overall, the birth rates of both countries experienced
Sample Essay:
The line graph gives the birth rates for two countries, China and the USA, over the 80-year period from 1920 to 2000.
Overall, the USA had a higher birth rate than China, with the exception of two short time spans, 1930-35 and 1945-1952. The two curves were highly positively correlated with lower values at the end of the period compared to the beginning.
In
Information is provided in this graph about fertility compared between USA and China over a period of 80 years.
It is clear that the birth rate in China rose dramatically from 1950 to 1955. Besides, sharply growht was occured in America at that period but slightly below from the Chinese.
Between 1920 and arond 1927, The number of people who was born in both countries was
 Related Questions