
IELTS WRITING TASK 1 LINE GRAPH
PLEASE EVALUATE MY WRITING. THANK YOU SO MUCH!
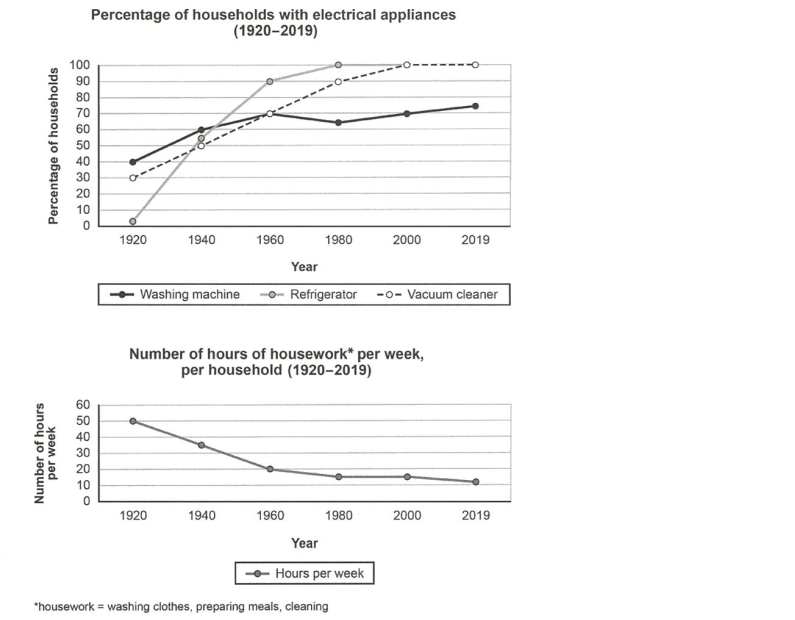
The two line graphs show how ownership of three electrical appliances (washing machine, refrigerator and vacuum cleaner) and amount of time allocated to housework changed from 1920 to 2019.
Overall, the proportions of households with electrical appliances rose significantly throughout the period while the number of hours doing housework decreased dramatically.
In the first year of the period, the number of households having refrigerators was barely 0%, after which this figure experienced a steep rise of about 55% in 1940 and continued to grow to reach its peak of 100% in 1980. The figures for refrigerators saw no changes over the last 39 years of the period. The disparity between the figures in 1920 and 1940 was the same in washing machine and vacuum cleaner, at 20%. However, while the former had a small fluctuation in 1980 before hitting the peak of around 75% in 2019, the latter rose stably to 100% in 2000 and remained the same in the next 19 years.
The period from 1920 to 1940 witnessed a sharp decline from 50% to approximately 35% in the amount of time spent on chores (washing clothes, preparing meals, cleaning). This was followed by continuous falls to exactly 20% in 2960 and around 15% in 1980. The figure then stayed constant before dropping to 10% in 2019.
Top answer
) ownership of three electrical appliances (washing machine, refrigerator and vacuum cleaner) and amount of time allocated to housework changed from 1920 to 2019. Overall, the proportions of households with electrical appliances rose significantly throughout the period while the number of hours doing housework decreased dramatically. ) 100% in 1980.
- ) ownership of three electrical appliances (washing machine, refrigerator and vacuum cleaner) and amount of time allocated to housework changed from 1920 to 2019.
- Overall, the proportions of households with electrical appliances rose significantly throughout the period while the number of hours doing housework decreased dramatically.
- ) 100% in 1980.
- The figures (wrong word) for refrigerators saw (wrong word) no changes over the last 39 years of the period.
- The disparity (wrong word.
Get the Weekly English Kit 📬
New words, one handy idiom, and a 2-minute quiz — delivered to your inbox to keep your streak alive.
The two line graphs show how (What is plotted?) ownership of three electrical appliances (washing machine, refrigerator and vacuum cleaner) and amount of time allocated to housework changed from 1920 to 2019.
Overall, the proportions of households with electrical appliances rose significantly throughout the period whil
Sample Essay (It is too long but gives you some model sentences.)
The first line graph plots the percentage of homes which have purchased a labor-saving household appliance in a particular country between 1920 and 2019. Three appliances are in the graph: refrigerator, vacuum cleaner and washing machine. The second line graph plots the average amount of time spent weekly on common chores
 Related Questions