
Ielts writing - task 1- line graph
The line graph compares the percentage of global usage of five various types of information and communication technology(ICT) between 1998 and 2008
Overall, the cell phone was one form used the most until 2008, seemingly it died out while the internet became more and more popular throughout the period shown.
In 1998, the proportion of universal landline use led the way with around 8%, which was followed by the percentages of mobile phone and the internet, at 5% and 3% respectively. Over a decade, landline usage plunged suddenly to 0% before reaching its high of approximately 45% in 2007. In contrast, 2008 experienced a significant increase to around 23% of internet usage and became the highest percentage, compared to only 20% of landline use.
In terms of fixed broadband, no one used this form in 1998. However, there was a gradual rise to about 13% in the percentage of worldwide fixed broadband use while it was not until 2003, wifi launched and wifi usage also rose to 12% in the next five years.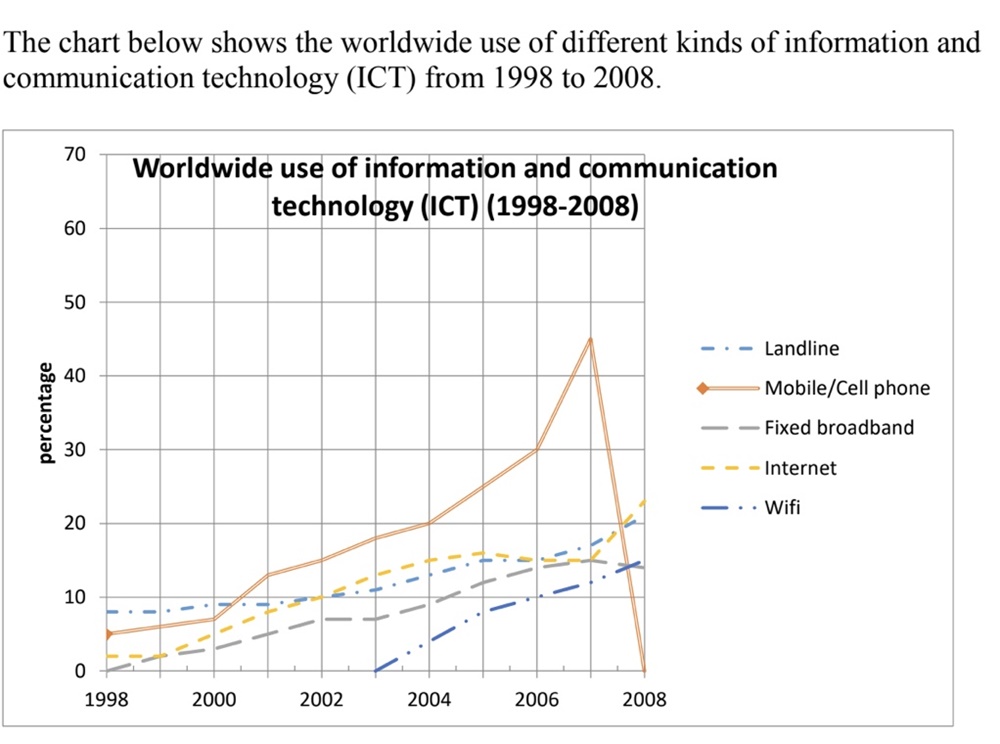
Top answer
The line graph compares the percentage of global usage of five various types of information and communication technology (ICT) between 1998 and 200 8. Overall, the cell phone was the one form used the most until 2008, when it seemingly it d ied ou t, while the internet others became more and more popular throughout the period shown. ----------------------------------------- The rest of that text is messy and has significant errors.
- The line graph compares the percentage of global usage of five various types of information and communication technology (ICT) between 1998 and 200 8.
- Overall, the cell phone was the one form used the most until 2008, when it seemingly it d ied ou t, while the internet others became more and more popular throughout the period shown.
- ----------------------------------------- The rest of that text is messy and has significant errors.
- 1- Simplify (untangle) your description.
- 2- ALWAYS check your work before submitting it.
Get the Weekly English Kit 📬
New words, one handy idiom, and a 2-minute quiz — delivered to your inbox to keep your streak alive.
The line graph compares the percentage of global usage of five various types of information and communication technology (ICT) between 1998 and 2008.
Overall, the cell phone was the one form used the most until 2008, when it seemin
 Related Questions