
IELTS writing task 1 - Line graph
Hello,
I've finished my IELTS writing task 1. Please take your time to help me review it.
Thanks a lot!
Question:
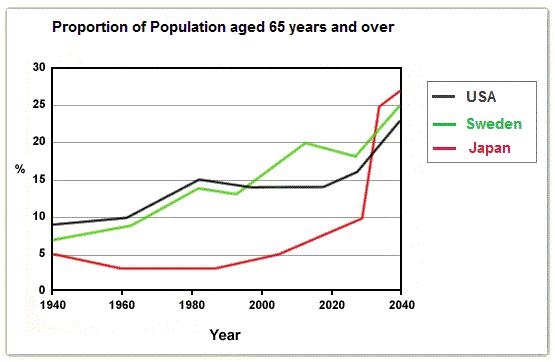
The graph below shows the proportion of the population aged 65 and over between 1940 and 2040 in three different countries.
My essay:
The line graph compares the percentage of population being older than 65 years old in the USA, Sweden and Japan from 1940 to 2040.
Overall, the percentage of population aged 65 years and over has increased in three countries during the research period. At first, Japan had the smallest percentage of elderly people; however its figure is predicted to become the biggest at the end of the period.
In 1940, the USA had the largest proportion of elderly people with nearly 10%, compared with 7% and 5% of Sweden and Japan respectively. Over the following 78 years, there was a slight drop of about 3.5% in Japanese population aged over 65 years in 1983, but later the figure went up to nearly 7% in 2018. At the same time, the figures of the USA and Sweden increased to 20% and 14% respectively.
Between 2018 and 2040, the proportion of Japanese old people is predicted to rise the most rapidly to 27% in 2040. Also, there is a dramatic increase in the predicted figures of the USA and Sweden, with 9% and 6% respectively.
Top answer
The line graph compares the percentage of population being older than 65 years old in the USA, Sweden and Japan from 1940 to 2040. ) period. ) people; however its figure (In academic articles, "figure" is an illustration or graph inserted into the text.
- The line graph compares the percentage of population being older than 65 years old in the USA, Sweden and Japan from 1940 to 2040.
- ) period.
- ) people; however its figure (In academic articles, "figure" is an illustration or graph inserted into the text.
- ) it is predicted to have the largest value become the biggest at the end of the period.
- In 1940, the USA had the largest proportion of elderly people with nearly 10%, compared with 7% and 5% of Sweden and Japan respectively.
Get the Weekly English Kit 📬
New words, one handy idiom, and a 2-minute quiz — delivered to your inbox to keep your streak alive.
The line graph compares the percentage of population being older than 65 years old in the USA, Sweden and Japan from 1940 to 2040.
Overall, the percentage of population aged 65 years and over has increased in three countries during the research (There is no information that this was any research study.) period. At first, Japan had the smallest percentage of
 Related Questions