
IELTS Writing Task 1 - Line Graph
Hello all! I've just finished an essay for this graph. Could you please help me to correct my mistakes in this essay and give me some comments on it? Thank you so much!
Here is my essay:
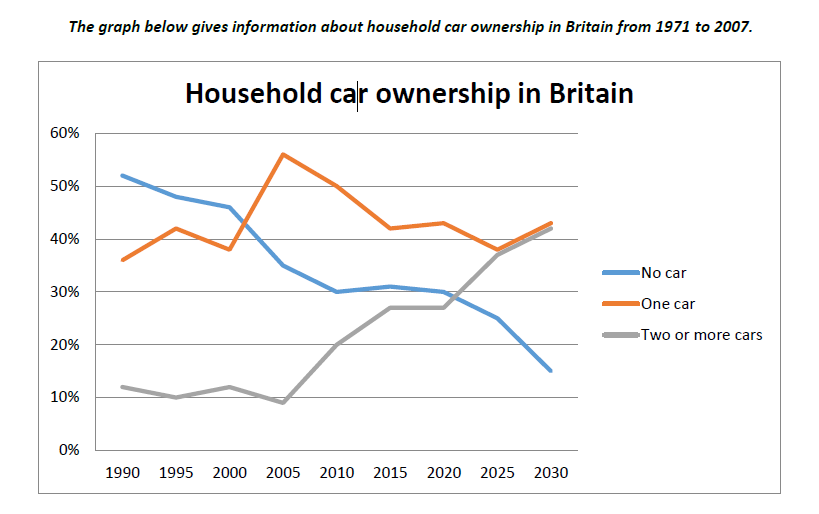
The graph illustrates information about the number of car owned by British households over the period of 40 years between 1990 and 2030.
It is clear that the proportion of households which own no car declined during the given time while the opposite was true for families which has one or more cars. In addition, two-or-more-car family was the least common type for most of the period shown.
In 1990, the proportion of households which do not have any cars was 51 percent in comparison with 35 percent and 12 percent of Britain families which had one car and two or more cars respectively. During the next 15 years, the figure for families which owns one car rose rapidly and finally reached a peak at 55 percent in 2005, whereas that of households having no car witnessed a sharp drop of about 15 percent. In addition, a small fluctuation could be seen in the proportion of households having two cars and above during the same period.
From 2005 onwards, the figure for one-car ownership is expected to fall substaintially to just under 40 percent but then recover slightly to 42 percent in the year 2030. Meanwhile, the proportion of families which own no car is said to fall dramatically in contrast to a steady growth of that of households having more than two cars.
Top answer
The graph illustrates information about the number of car owned by the percentages of British households who owned one; two or more; or no cars over the period of 4 0-year period between starting in 1990 , with a projection out to and 2030. It is clear that the proportion of households which own no car declined during for most of the given timespan and is set to continue falling, while the opposite was is true for families which has one have two or more cars. In addition, the percentage of families with one car peaked just after 2005, and declined after that, although a slight recovery is anticipated after 2025.
- The graph illustrates information about the number of car owned by the percentages of British households who owned one; two or more; or no cars over the period of 4 0-year period between starting in 1990 , with a projection out to and 2030.
- It is clear that the proportion of households which own no car declined during for most of the given timespan and is set to continue falling, while the opposite was is true for families which has one have two or more cars.
- In addition, the percentage of families with one car peaked just after 2005, and declined after that, although a slight recovery is anticipated after 2025.
- two-or-more-car family was the least common type for most of the period shown.
- In 1990, the proportion of households in Britain which do did not have any cars was 51 percent in comparison with 35 percent and 12 percent of Britain families for those which had one car and two or more cars respectively.
Get the Weekly English Kit 📬
New words, one handy idiom, and a 2-minute quiz — delivered to your inbox to keep your streak alive.
The graph illustrates information about the number of car owned by the percentages of British households who owned one; two or more; or no cars over the period of 40-year period between starting in
 Related Questions