
IELTS Writing Task 1 - Line graph
(red line is China's, blue line is USA's).
It would be nice if someone could give me an estimated band score.
Here's my essay:
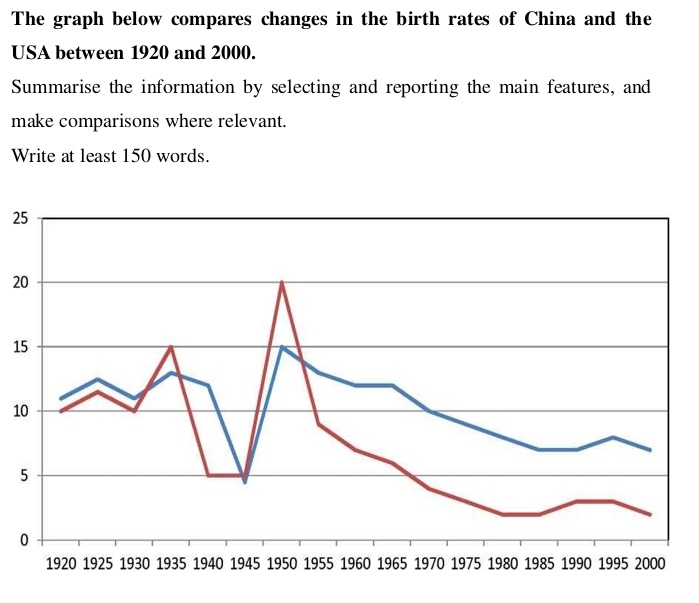
The graph gives a comparison of changes in birth rates between USA and China during the period from 1920 to 2000.
Overall, it can be seen that although the birth rate in USA was higher in most the of the years, both countries’ birth rates followed a similar trend of a general decline.
During the period from 1920 to 1935, birth rates of both countries fluctuated, but by 1935, these rates both increased by about 5% compared to 1920. After that, birth rates of the two countries dropped dramatically. By 1945, both had decreased to below 5%.
In the next 5 years, these rates skyrocketted and by 1950, both hit their own peaks of 20% for China and 15% for USA. After that, birth rates of both countries started to decrease. By 2000, China’s birth rate had dropped to 3% from 20% in 1950, while that in USA was still kept above 7%.
(153 words).
Get the Weekly English Kit 📬
New words, one handy idiom, and a 2-minute quiz — delivered to your inbox to keep your streak alive.
 Related Questions