
IELTS writing task 1, line graph
Please help me check my writing
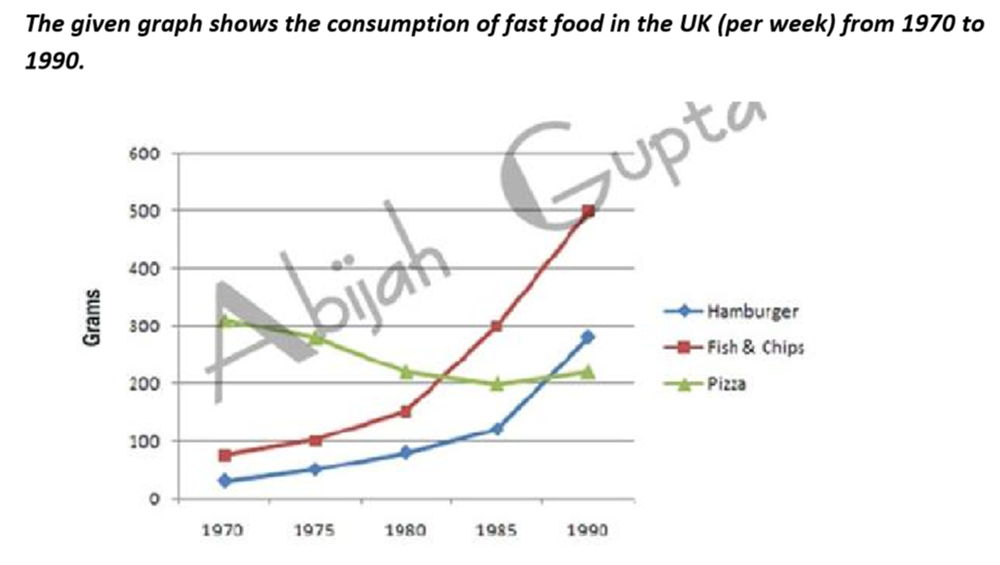
The line graph demonstrates how much fast food was weekly consumed by UK people over the course of 20 years starting from 1970.
Overall, the amount of fish & chips eaten in the UK experienced the most dramatic change during the period. In addition, the quantities of both hamburger and fish & chips consumed increased, while there was a slight decrease in the figure of pizza.
It is clear from the graph that the amount of pizza consumed by UK people was the highest, more than 300 grams, while the figure of hamburger was significantly lower, at about 30 grams in 1970. At the same time, approximately 80 grams of fish & chips were eaten in a week in the UK.
In 1990, the quantities of fish & chips consumed rose sharply to 500 grams and became the highest figure. Likewise, the similar trend was witnessed in hamburger, which stood at nearly 300 grams. By contrast, the figure of pizza remained stable at roundly 200 grams.
Top answer
The instructions are not very precise. It probably shows a graph of the consumption of fast foods in the UK per person per week. The missing prepositional phrase causes your essay to go frightfully wrong.
- The instructions are not very precise.
- It probably shows a graph of the consumption of fast foods in the UK per person per week.
- The missing prepositional phrase causes your essay to go frightfully wrong.
- The line graph demonstrates how much fast food was weekly consumed (word order) by UK people over the course of 20 years starting from 1970.
- Overall, the amount of fish & chips eaten in the UK experienced the most dramatic change during the period.
Get the Weekly English Kit 📬
New words, one handy idiom, and a 2-minute quiz — delivered to your inbox to keep your streak alive.
The instructions are not very precise. It probably shows a graph of the consumption of fast foods in the UK per person per week. The missing prepositional phrase causes your essay to go frightfully wrong.
The line graph demonstrates how much fast food was weekly consumed (word order) by UK people over the course of 20 years starting from 1970.
Overall, th
Thuyduy Nguyenby UK people
by British people. See http://dictionary.cambridge.org/dictionary/english/british?q=British
You could instead write it as by people in
 Related Questions