
IELTS Writing Task 1 - Line Chart - Please Correct My Essay
The line chart demonstrates how much electricity was produced in France from 1980 to 2012.
Overall, it can be seen that there was an upward trend in electricity production from nuclear, as opposed to the data for the production of electricity from thermal, hydroelectricity, and renewables.
In 1980, standing at about 70 TW-h, the production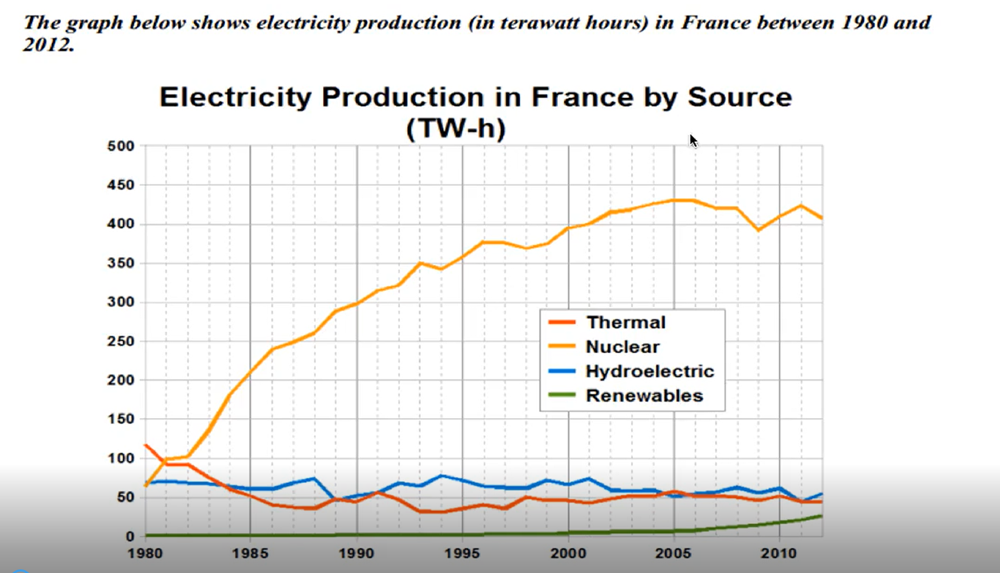
of electricity from nuclear increased dramatically to reach a record-high of over 425 TW-h in 2005. After one year, the amount of electricity from nuclear gradually fell to 405 TW-h in 2012. By contrast, the amount of electricity from renewables remained unchanged at 0 TW-h over a 20-year period, starting from 1980, before rising slowly to 25 TW-h in 2012.
In the first year of the period, thermal energy was the primary source of electricity in France and exceeded the data for hydroelectric by 50 TWh. Seven years later, a slight decrease of 40 TW-h was witnessed in electricity production from thermal. Electricity production from thermal and hydroelectric witnessed a negligible fluctuation for the rest of the period.
Top answer
Please read my advice for Task 1 essays: IELTS TASK 1: Hints, Tips And Advice Vocabulary Words For Task 1: Reference Post Rosie Jun The line chart There are pie charts, bar charts, Gantt charts, flow charts, eye charts and organization charts. There is no such thing as a line chart. Read my advice.
- Please read my advice for Task 1 essays: IELTS TASK 1: Hints, Tips And Advice Vocabulary Words For Task 1: Reference Post Rosie Jun The line chart There are pie charts, bar charts, Gantt charts, flow charts, eye charts and organization charts.
- There is no such thing as a line chart.
- Read my advice.
- Rosie Jun demonstrates Poor verb choice.
- Demonstrate is not applicable.
Get the Weekly English Kit 📬
New words, one handy idiom, and a 2-minute quiz — delivered to your inbox to keep your streak alive.
The line chart demonstrates The line graph compares how much electricity was produced in France from four fuel sources (thermal, nuclear, hydroelectric and renewables) from 1980 to 2012. The units are terawatt hours (TW-h).
(There were many iss
 Related Questions