
IELTS writing task 1( line chart)
This writing task was done last week but at that time i forgot to attach images so now, i redo it.
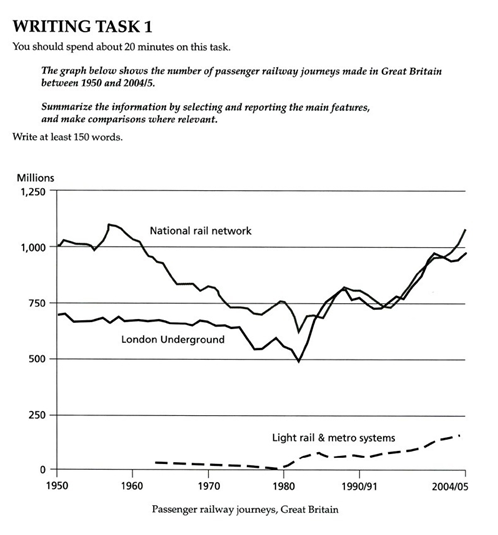
The graph below shows the number of passenger railway journeys made in Great Britain between 1950 and 2004/5.
Summarize the information by selecting and reporting main features, and make comparisons where relevant.
Writing task 1
The line chart illustrates how many trips are made by passenger on three railway systems in Great Britain from 1950 to 2004/05.
It is clear that between 1950 and 1960, the National rail network sprung up slightly from 1,000 to approximately 1,125 million passengers. However, from 1960 to the early 1980s, it declined rapidly by roughly 500 million passengers. Likewise, contemporaneously, the London Underground experienced a parallel, remained stable in the early period and then was a considerable deterioration of 500 million passengers. During 1980 and 2004/5, National rail network and London Underground suddenly peaked at roughly 1,125 and 1,000 million passengers respectively.
By comparison, in the 1960s, the light rail and metro systems embarked on working unfavorably by carrying fewer passengers than the other two networks, no more than about 10 million during the first 15 years. However, when the other two networks went down, the number of journey made by passengers soared up, reaching around 200 million in 2004/05.
Overall, the number of trips made by passenger on National rail network and London Underground fluctuated while the trend for Light rail and metro systems is upward.
188 words, excluding topic
Top answer
The line chart (Ther is no such thing as a "line chart") illustrates (Use "illustrate for maps and diagrams that show a picture. ) how many trips are (wrong tense. ) on three railway systems in Great Britain from 1950 to 2004/05.
- The line chart (Ther is no such thing as a "line chart") illustrates (Use "illustrate for maps and diagrams that show a picture.
- ) how many trips are (wrong tense.
- ) on three railway systems in Great Britain from 1950 to 2004/05.
- ) slightly from 1,000 to approximately 1,125 million passengers .
- However, from 1960 to the early 1980s, it declined rapidly by roughly 500 million passengers.
Get the Weekly English Kit 📬
New words, one handy idiom, and a 2-minute quiz — delivered to your inbox to keep your streak alive.
The line chart (Ther is no such thing as a "line chart") illustrates (Use "illustrate for maps and diagrams that show a picture. not for plots such as this one.) how many trips are (wrong tense. The data represents trips in the past.)
 Related Questions