
Ielts writing task 1. I want to know if I made progress. Please help me. Thanks.
My essay
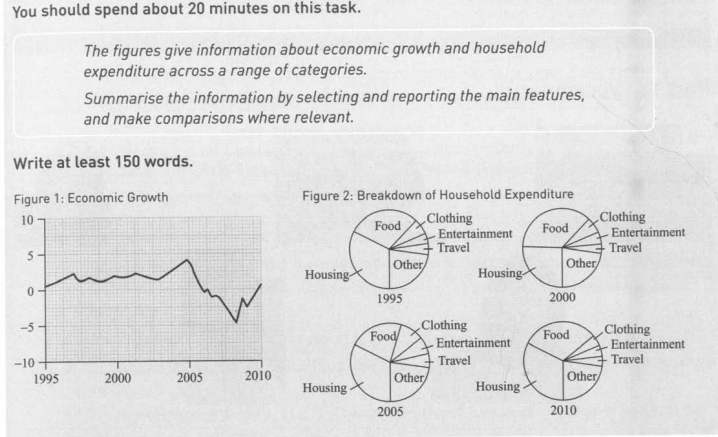
The line graph gives information about the percentage of economic growth through the five-year intervals ending in 2010. Besides, the four pie charts also show the breakdown of household expenditure in the same pattern for a range of categories.
At first glance, the economic growth started at one percent, since after it remained steady up and down until about 2003 and then peaked at the highest point (roughly 4%) in 2005. After that, it was followed by a sharp fall and reached the lowest point in 2008.
The rate of economic growth was also proportional to the household expenditure, which is particularly true. In the half-decade. from 1995 to 2000, the two pie charts show a similar pattern when the proportion of necessary things like food and housing accounted for more than 50%. Additionally, the inessential items like clothes, entertainment, and travel, were up to a higher proportion when the economy developed well in 2005.
Viewed together, two types of the graph are indicated to have a strong bond, the more money people get, the more they spend, and vice versa.
Top answer
I advise against using this practice test. There are no units of measure on the Y-axis of the graph, and the pie charts have no indication of the actual spending values. There are no numbers (values) on the pie charts.
- I advise against using this practice test.
- There are no units of measure on the Y-axis of the graph, and the pie charts have no indication of the actual spending values.
- There are no numbers (values) on the pie charts.
- Any correlation could easily be coincidence and misinterpreted as causation.
- Throw this practice task in the trash bin.
Get the Weekly English Kit 📬
New words, one handy idiom, and a 2-minute quiz — delivered to your inbox to keep your streak alive.
I advise against using this practice test.
There are no units of measure on the Y-axis of the graph, and the pie charts have no indication of the actual spending values. There are no numbers (values) on the pie charts. Any correlation could easily be coincidence and misinterpreted as causation.
Throw this practice task in the trash bin.
Pick something else.
niceday04 line graph gives information about
That is vague and imprecise. "Give information about" is not grammatically incorrect, but it is not very good for a math/science essay where exactness, accuracy and precision is expected.
niceday04percentage of economic growth
There is no scale on the y-axis. You cannot
 Related Questions