
IELTS writing task 1. I need your help to check my essay
This essay below is my homework in IELTS writing task 1
I hope you can check and correct it for me. I appreciate your help.
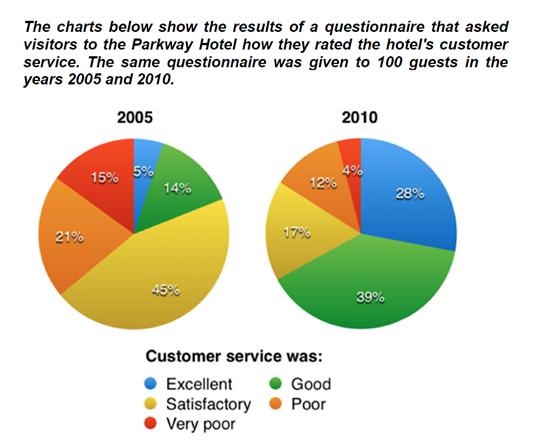
The given graph gives information about the survey result by 100 visitors who checked in the Parkway Hotel in 2005 and 2010 that how did they evaluate about the hotel's customer service.
It is clear that most guests just satisfied in 2005 but until 2010, the majority of visitor rated excellent with Parkway Hotel’s customer service.
In 2005, the figure for guests decribed customer service in the hotel as satisfaction which accounted for the highest proportion, at 45% of the total survey results in Pathway Hotel while that of poor, very poor and good were slightly lower, at 21%, 15% and 14% respectively. Besides, the lowest figure can be seen the percentage of guests who thought customer service was excellent, at only 5%.
In 2010, the percentage of guests rated satisfaction decreased significantly and did not remain the highest figure in the chart, at 17%. In sharply contrast to this, the figure for good evaluation rocketed a pick of 39%. Similarly, there was a sharp increase to 28% in the figure for excellent rate while, that for poor and very poor witnessed a dramatic fall of at 12% and 4% respectively.
Get the Weekly English Kit 📬
New words, one handy idiom, and a 2-minute quiz — delivered to your inbox to keep your streak alive.
 Related Questions