
Ielts writing task 1, help me to check this essay, thank you so much
Topic: The first chart below gives information about the money spent by British parents on their children’s sports between 2008 and 2014. The second chart shows the number of children who participated in three sports in Britain over the same time period.
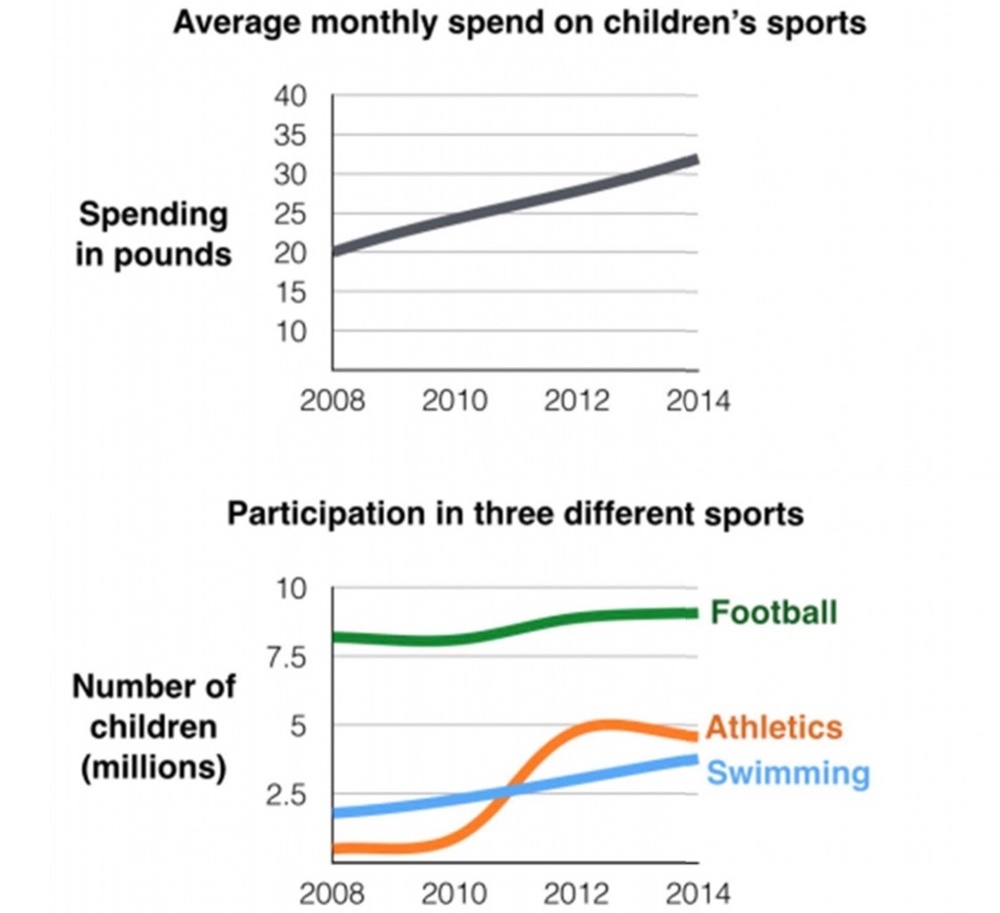
The charts demonstrate the British parents spent how much money on their children’s sport a month and how many children who took part in football, athletics and swimming over a course 5 years starting from 2008.
As can be seen from the charts, it is clearly evident that the amount of money spent witnessed an upward trend, the figure of children of swimming went up sharply, that of swimming increased slightly and that of athletics remained relatively stable.
Each British parent was used money for their children’s sports enrollment that stood at 20 a month in 2008. Then it rose steady and packed at roughly 35 per month in 2014.
The first sport is athletics which the number of children was approximately 0.1 millions in 2008 that leveled off in the next 2 years. The year 2012 was witnessed a dramatic climb in the figure of children at 5 that stayed unchanged in 2014. The second sport is swimming which the number of children started at roughly 2.5 in 2008 that grew modestly around 5 in 2014. The number of children of football evened out from 2008 to 2014 at about 8.
Get the Weekly English Kit 📬
New words, one handy idiom, and a 2-minute quiz — delivered to your inbox to keep your streak alive.
 Related Questions